Immigrants from Asia vs Scandinavian 4 or more Vehicles in Household
COMPARE
Immigrants from Asia
Scandinavian
4 or more Vehicles in Household
4 or more Vehicles in Household Comparison
Immigrants from Asia
Scandinavians
6.8%
4 OR MORE VEHICLES IN HOUSEHOLD
94.4/ 100
METRIC RATING
124th/ 347
METRIC RANK
8.0%
4 OR MORE VEHICLES IN HOUSEHOLD
100.0/ 100
METRIC RATING
37th/ 347
METRIC RANK
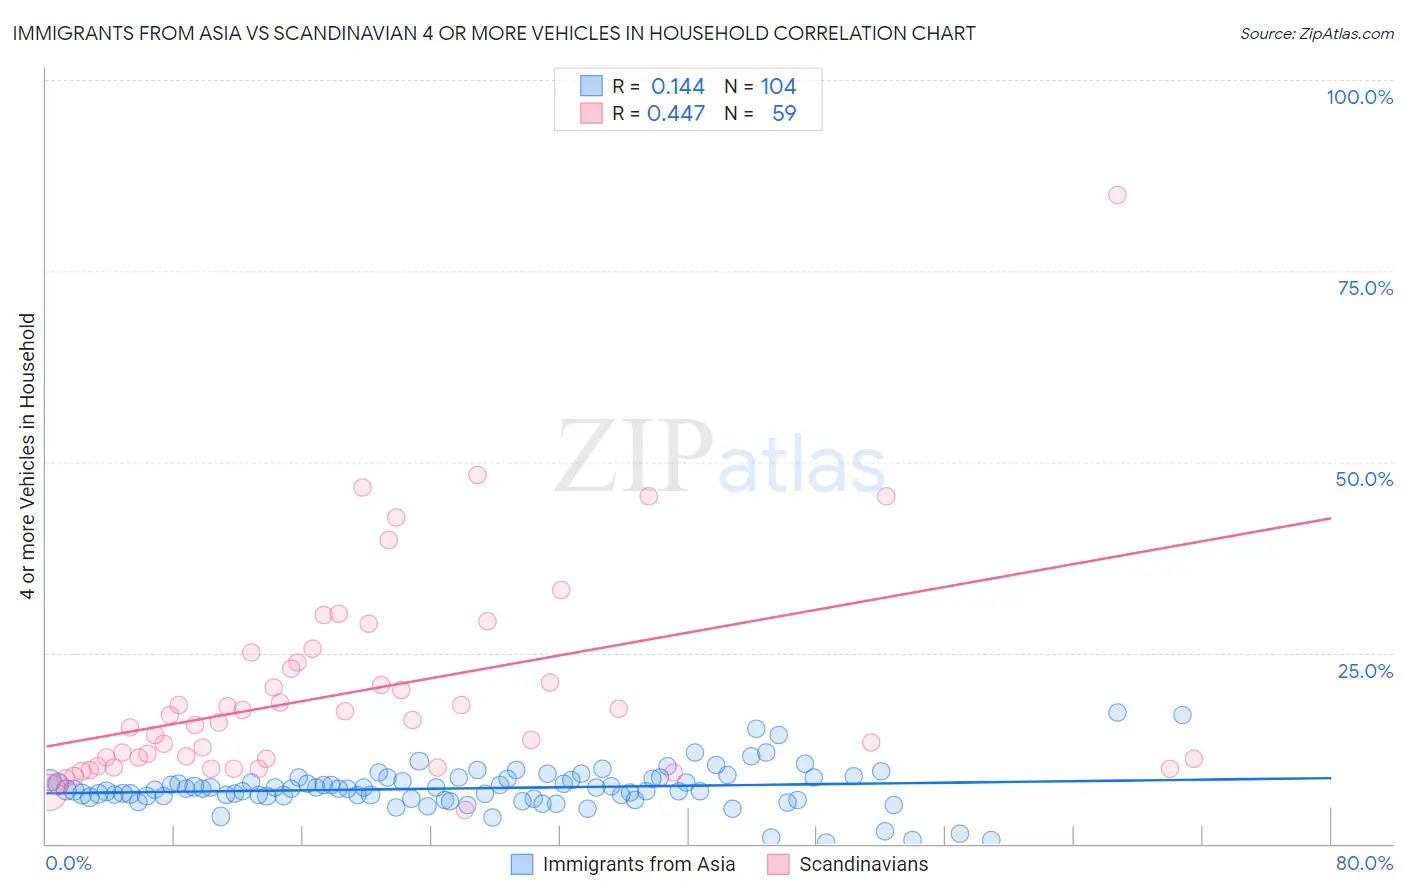
Immigrants from Asia vs Scandinavian 4 or more Vehicles in Household Correlation Chart
The statistical analysis conducted on geographies consisting of 545,943,212 people shows a poor positive correlation between the proportion of Immigrants from Asia and percentage of households with 4 or more vehicles available in the United States with a correlation coefficient (R) of 0.144 and weighted average of 6.8%. Similarly, the statistical analysis conducted on geographies consisting of 470,673,976 people shows a moderate positive correlation between the proportion of Scandinavians and percentage of households with 4 or more vehicles available in the United States with a correlation coefficient (R) of 0.447 and weighted average of 8.0%, a difference of 17.8%.
4 or more Vehicles in Household Correlation Summary
| Measurement | Immigrants from Asia | Scandinavian |
| Minimum | 0.13% | 4.3% |
| Maximum | 17.2% | 85.0% |
| Range | 17.1% | 80.7% |
| Mean | 7.3% | 19.8% |
| Median | 7.2% | 15.9% |
| Interquartile 25% (IQ1) | 6.2% | 10.2% |
| Interquartile 75% (IQ3) | 8.6% | 23.7% |
| Interquartile Range (IQR) | 2.4% | 13.5% |
| Standard Deviation (Sample) | 2.8% | 13.9% |
| Standard Deviation (Population) | 2.8% | 13.8% |
Similar Demographics by 4 or more Vehicles in Household
Demographics Similar to Immigrants from Asia by 4 or more Vehicles in Household
In terms of 4 or more vehicles in household, the demographic groups most similar to Immigrants from Asia are Immigrants (6.8%, a difference of 0.10%), Austrian (6.8%, a difference of 0.10%), Belgian (6.8%, a difference of 0.10%), Immigrants from Germany (6.8%, a difference of 0.16%), and Immigrants from Nicaragua (6.8%, a difference of 0.16%).
| Demographics | Rating | Rank | 4 or more Vehicles in Household |
| Burmese | 95.7 /100 | #117 | Exceptional 6.8% |
| French American Indians | 95.7 /100 | #118 | Exceptional 6.8% |
| Costa Ricans | 95.5 /100 | #119 | Exceptional 6.8% |
| Comanche | 94.8 /100 | #120 | Exceptional 6.8% |
| Immigrants | Germany | 94.7 /100 | #121 | Exceptional 6.8% |
| Immigrants | Nicaragua | 94.7 /100 | #122 | Exceptional 6.8% |
| Immigrants | Immigrants | 94.6 /100 | #123 | Exceptional 6.8% |
| Immigrants | Asia | 94.4 /100 | #124 | Exceptional 6.8% |
| Austrians | 94.1 /100 | #125 | Exceptional 6.8% |
| Belgians | 94.1 /100 | #126 | Exceptional 6.8% |
| Immigrants | Korea | 93.8 /100 | #127 | Exceptional 6.8% |
| Immigrants | Bolivia | 92.5 /100 | #128 | Exceptional 6.7% |
| Immigrants | England | 92.0 /100 | #129 | Exceptional 6.7% |
| Immigrants | Scotland | 89.0 /100 | #130 | Excellent 6.7% |
| Maltese | 88.4 /100 | #131 | Excellent 6.7% |
Demographics Similar to Scandinavians by 4 or more Vehicles in Household
In terms of 4 or more vehicles in household, the demographic groups most similar to Scandinavians are Sioux (8.0%, a difference of 0.030%), Norwegian (8.0%, a difference of 0.17%), Spanish American (8.0%, a difference of 0.26%), Spanish (7.9%, a difference of 0.89%), and Guamanian/Chamorro (8.1%, a difference of 0.96%).
| Demographics | Rating | Rank | 4 or more Vehicles in Household |
| Navajo | 100.0 /100 | #30 | Exceptional 8.2% |
| Natives/Alaskans | 100.0 /100 | #31 | Exceptional 8.2% |
| Marshallese | 100.0 /100 | #32 | Exceptional 8.1% |
| Yaqui | 100.0 /100 | #33 | Exceptional 8.1% |
| Alaskan Athabascans | 100.0 /100 | #34 | Exceptional 8.1% |
| Guamanians/Chamorros | 100.0 /100 | #35 | Exceptional 8.1% |
| Norwegians | 100.0 /100 | #36 | Exceptional 8.0% |
| Scandinavians | 100.0 /100 | #37 | Exceptional 8.0% |
| Sioux | 100.0 /100 | #38 | Exceptional 8.0% |
| Spanish Americans | 100.0 /100 | #39 | Exceptional 8.0% |
| Spanish | 100.0 /100 | #40 | Exceptional 7.9% |
| Pima | 100.0 /100 | #41 | Exceptional 7.9% |
| Salvadorans | 100.0 /100 | #42 | Exceptional 7.8% |
| Fijians | 100.0 /100 | #43 | Exceptional 7.8% |
| Bhutanese | 100.0 /100 | #44 | Exceptional 7.8% |