Peruvian vs Scandinavian 4 or more Vehicles in Household
COMPARE
Peruvian
Scandinavian
4 or more Vehicles in Household
4 or more Vehicles in Household Comparison
Peruvians
Scandinavians
6.5%
4 OR MORE VEHICLES IN HOUSEHOLD
69.4/ 100
METRIC RATING
157th/ 347
METRIC RANK
8.0%
4 OR MORE VEHICLES IN HOUSEHOLD
100.0/ 100
METRIC RATING
37th/ 347
METRIC RANK
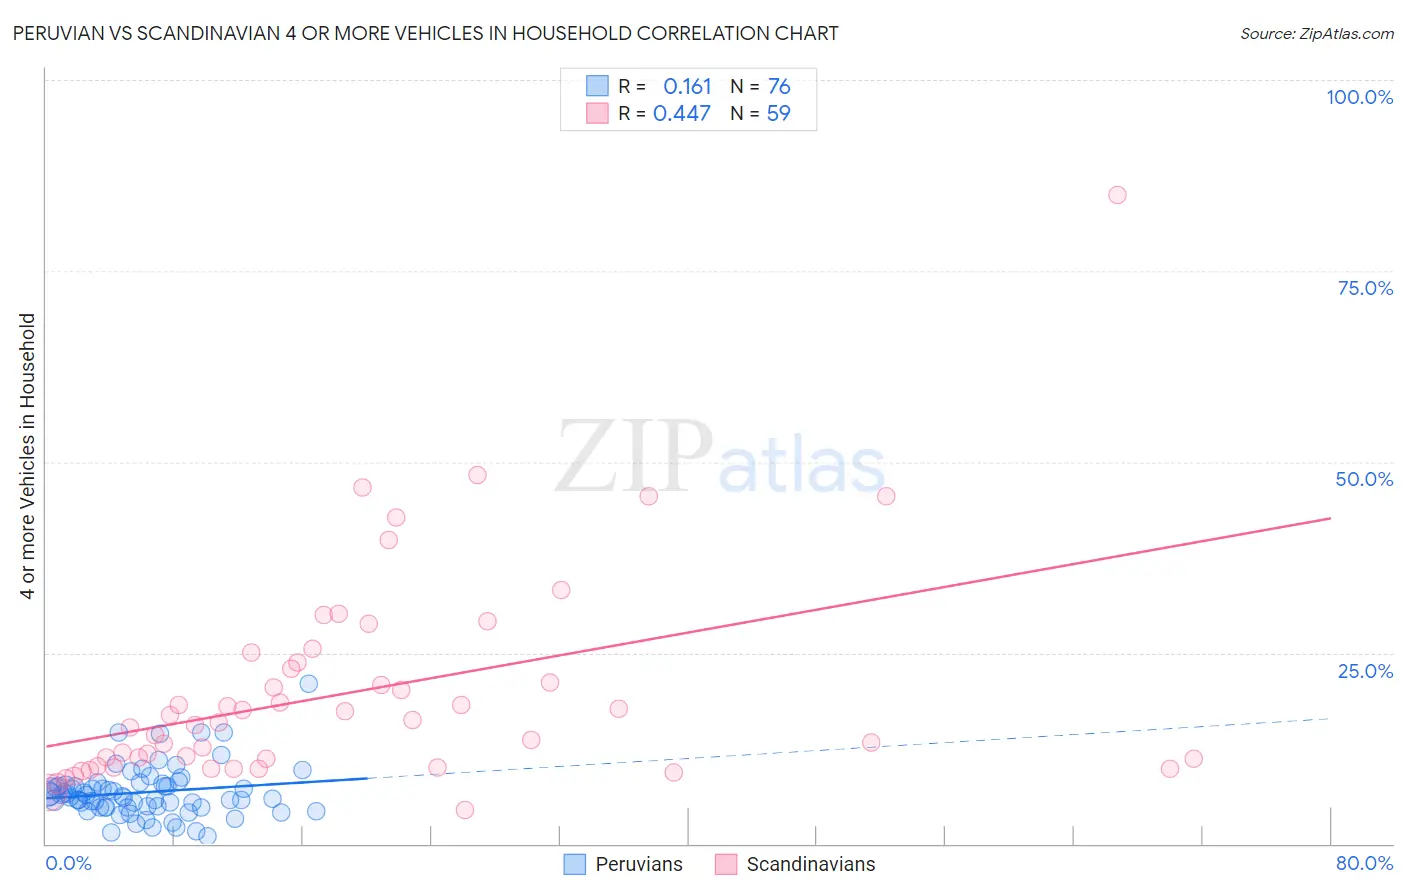
Peruvian vs Scandinavian 4 or more Vehicles in Household Correlation Chart
The statistical analysis conducted on geographies consisting of 361,410,138 people shows a poor positive correlation between the proportion of Peruvians and percentage of households with 4 or more vehicles available in the United States with a correlation coefficient (R) of 0.161 and weighted average of 6.5%. Similarly, the statistical analysis conducted on geographies consisting of 470,673,976 people shows a moderate positive correlation between the proportion of Scandinavians and percentage of households with 4 or more vehicles available in the United States with a correlation coefficient (R) of 0.447 and weighted average of 8.0%, a difference of 23.6%.
4 or more Vehicles in Household Correlation Summary
| Measurement | Peruvian | Scandinavian |
| Minimum | 0.93% | 4.3% |
| Maximum | 20.9% | 85.0% |
| Range | 20.0% | 80.7% |
| Mean | 6.7% | 19.8% |
| Median | 6.3% | 15.9% |
| Interquartile 25% (IQ1) | 4.8% | 10.2% |
| Interquartile 75% (IQ3) | 7.6% | 23.7% |
| Interquartile Range (IQR) | 2.8% | 13.5% |
| Standard Deviation (Sample) | 3.3% | 13.9% |
| Standard Deviation (Population) | 3.3% | 13.8% |
Similar Demographics by 4 or more Vehicles in Household
Demographics Similar to Peruvians by 4 or more Vehicles in Household
In terms of 4 or more vehicles in household, the demographic groups most similar to Peruvians are Iranian (6.5%, a difference of 0.050%), Iroquois (6.5%, a difference of 0.11%), Central American Indian (6.5%, a difference of 0.19%), Immigrants from Armenia (6.5%, a difference of 0.21%), and Zimbabwean (6.4%, a difference of 0.27%).
| Demographics | Rating | Rank | 4 or more Vehicles in Household |
| New Zealanders | 73.3 /100 | #150 | Good 6.5% |
| Immigrants | Hong Kong | 72.2 /100 | #151 | Good 6.5% |
| Yuman | 72.1 /100 | #152 | Good 6.5% |
| Immigrants | Armenia | 71.2 /100 | #153 | Good 6.5% |
| Central American Indians | 71.1 /100 | #154 | Good 6.5% |
| Iroquois | 70.4 /100 | #155 | Good 6.5% |
| Iranians | 69.9 /100 | #156 | Good 6.5% |
| Peruvians | 69.4 /100 | #157 | Good 6.5% |
| Zimbabweans | 67.1 /100 | #158 | Good 6.4% |
| Indians (Asian) | 66.3 /100 | #159 | Good 6.4% |
| Palestinians | 65.8 /100 | #160 | Good 6.4% |
| Immigrants | Cameroon | 64.4 /100 | #161 | Good 6.4% |
| Immigrants | Pakistan | 63.2 /100 | #162 | Good 6.4% |
| Chileans | 61.2 /100 | #163 | Good 6.4% |
| Hungarians | 61.1 /100 | #164 | Good 6.4% |
Demographics Similar to Scandinavians by 4 or more Vehicles in Household
In terms of 4 or more vehicles in household, the demographic groups most similar to Scandinavians are Sioux (8.0%, a difference of 0.030%), Norwegian (8.0%, a difference of 0.17%), Spanish American (8.0%, a difference of 0.26%), Spanish (7.9%, a difference of 0.89%), and Guamanian/Chamorro (8.1%, a difference of 0.96%).
| Demographics | Rating | Rank | 4 or more Vehicles in Household |
| Navajo | 100.0 /100 | #30 | Exceptional 8.2% |
| Natives/Alaskans | 100.0 /100 | #31 | Exceptional 8.2% |
| Marshallese | 100.0 /100 | #32 | Exceptional 8.1% |
| Yaqui | 100.0 /100 | #33 | Exceptional 8.1% |
| Alaskan Athabascans | 100.0 /100 | #34 | Exceptional 8.1% |
| Guamanians/Chamorros | 100.0 /100 | #35 | Exceptional 8.1% |
| Norwegians | 100.0 /100 | #36 | Exceptional 8.0% |
| Scandinavians | 100.0 /100 | #37 | Exceptional 8.0% |
| Sioux | 100.0 /100 | #38 | Exceptional 8.0% |
| Spanish Americans | 100.0 /100 | #39 | Exceptional 8.0% |
| Spanish | 100.0 /100 | #40 | Exceptional 7.9% |
| Pima | 100.0 /100 | #41 | Exceptional 7.9% |
| Salvadorans | 100.0 /100 | #42 | Exceptional 7.8% |
| Fijians | 100.0 /100 | #43 | Exceptional 7.8% |
| Bhutanese | 100.0 /100 | #44 | Exceptional 7.8% |