Immigrants from Guyana vs Scandinavian 4 or more Vehicles in Household
COMPARE
Immigrants from Guyana
Scandinavian
4 or more Vehicles in Household
4 or more Vehicles in Household Comparison
Immigrants from Guyana
Scandinavians
3.4%
4 OR MORE VEHICLES IN HOUSEHOLD
0.0/ 100
METRIC RATING
344th/ 347
METRIC RANK
8.0%
4 OR MORE VEHICLES IN HOUSEHOLD
100.0/ 100
METRIC RATING
37th/ 347
METRIC RANK
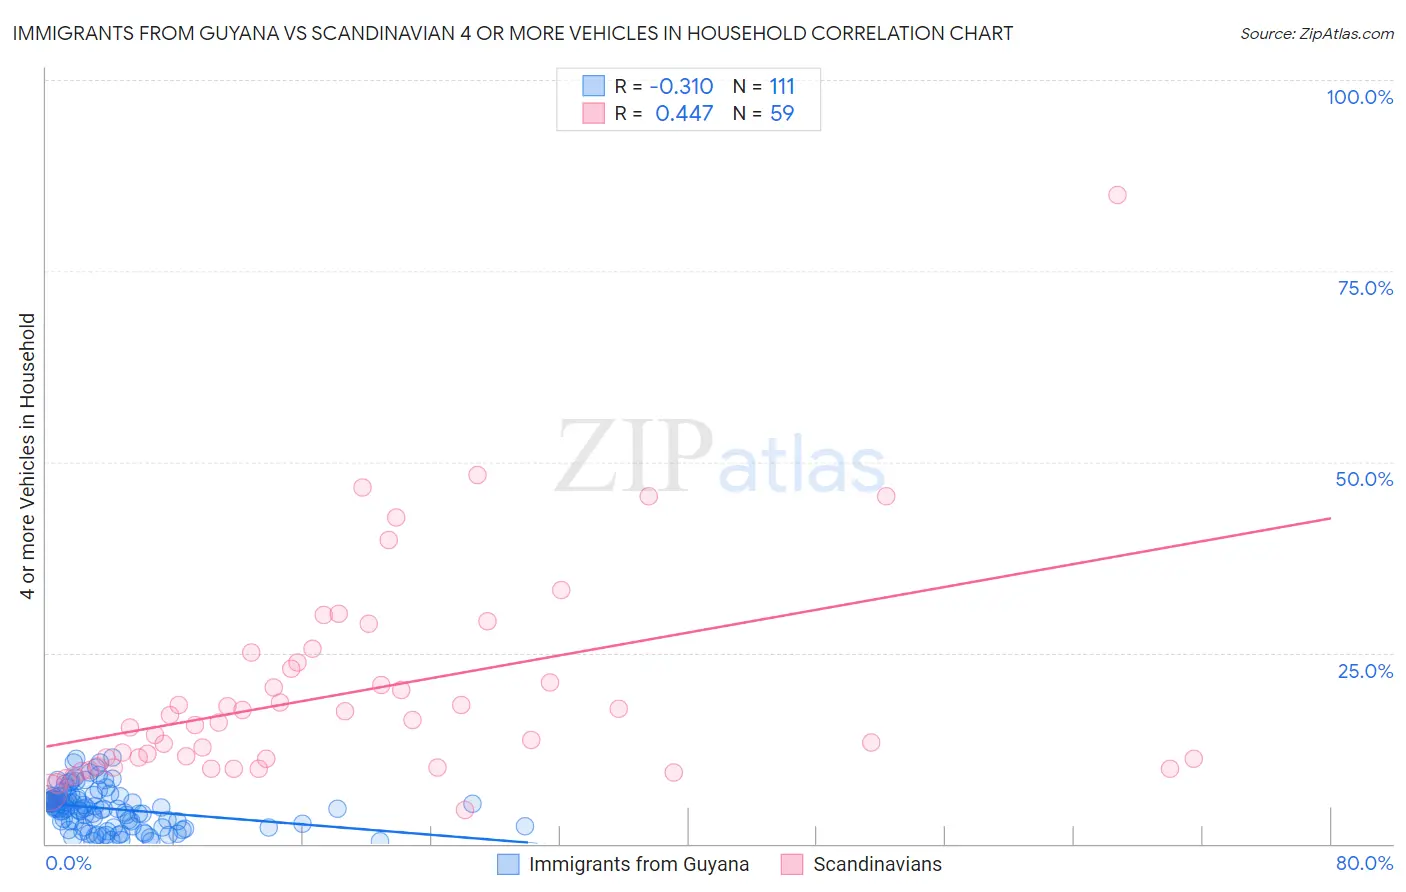
Immigrants from Guyana vs Scandinavian 4 or more Vehicles in Household Correlation Chart
The statistical analysis conducted on geographies consisting of 182,580,983 people shows a mild negative correlation between the proportion of Immigrants from Guyana and percentage of households with 4 or more vehicles available in the United States with a correlation coefficient (R) of -0.310 and weighted average of 3.4%. Similarly, the statistical analysis conducted on geographies consisting of 470,673,976 people shows a moderate positive correlation between the proportion of Scandinavians and percentage of households with 4 or more vehicles available in the United States with a correlation coefficient (R) of 0.447 and weighted average of 8.0%, a difference of 134.9%.
4 or more Vehicles in Household Correlation Summary
| Measurement | Immigrants from Guyana | Scandinavian |
| Minimum | 0.29% | 4.3% |
| Maximum | 11.2% | 85.0% |
| Range | 10.9% | 80.7% |
| Mean | 4.6% | 19.8% |
| Median | 4.6% | 15.9% |
| Interquartile 25% (IQ1) | 2.2% | 10.2% |
| Interquartile 75% (IQ3) | 6.2% | 23.7% |
| Interquartile Range (IQR) | 4.0% | 13.5% |
| Standard Deviation (Sample) | 2.6% | 13.9% |
| Standard Deviation (Population) | 2.6% | 13.8% |
Similar Demographics by 4 or more Vehicles in Household
Demographics Similar to Immigrants from Guyana by 4 or more Vehicles in Household
In terms of 4 or more vehicles in household, the demographic groups most similar to Immigrants from Guyana are British West Indian (3.5%, a difference of 1.6%), Guyanese (3.5%, a difference of 2.6%), Dominican (3.5%, a difference of 3.3%), Immigrants from Dominican Republic (3.3%, a difference of 4.1%), and Immigrants from Barbados (3.6%, a difference of 6.1%).
| Demographics | Rating | Rank | 4 or more Vehicles in Household |
| Immigrants | Albania | 0.0 /100 | #333 | Tragic 4.1% |
| Immigrants | Trinidad and Tobago | 0.0 /100 | #334 | Tragic 4.1% |
| Barbadians | 0.0 /100 | #335 | Tragic 3.9% |
| Immigrants | Bangladesh | 0.0 /100 | #336 | Tragic 3.9% |
| Vietnamese | 0.0 /100 | #337 | Tragic 3.9% |
| Immigrants | Cabo Verde | 0.0 /100 | #338 | Tragic 3.8% |
| Immigrants | Uzbekistan | 0.0 /100 | #339 | Tragic 3.6% |
| Immigrants | Barbados | 0.0 /100 | #340 | Tragic 3.6% |
| Dominicans | 0.0 /100 | #341 | Tragic 3.5% |
| Guyanese | 0.0 /100 | #342 | Tragic 3.5% |
| British West Indians | 0.0 /100 | #343 | Tragic 3.5% |
| Immigrants | Guyana | 0.0 /100 | #344 | Tragic 3.4% |
| Immigrants | Dominican Republic | 0.0 /100 | #345 | Tragic 3.3% |
| Immigrants | St. Vincent and the Grenadines | 0.0 /100 | #346 | Tragic 3.0% |
| Immigrants | Grenada | 0.0 /100 | #347 | Tragic 2.7% |
Demographics Similar to Scandinavians by 4 or more Vehicles in Household
In terms of 4 or more vehicles in household, the demographic groups most similar to Scandinavians are Sioux (8.0%, a difference of 0.030%), Norwegian (8.0%, a difference of 0.17%), Spanish American (8.0%, a difference of 0.26%), Spanish (7.9%, a difference of 0.89%), and Guamanian/Chamorro (8.1%, a difference of 0.96%).
| Demographics | Rating | Rank | 4 or more Vehicles in Household |
| Navajo | 100.0 /100 | #30 | Exceptional 8.2% |
| Natives/Alaskans | 100.0 /100 | #31 | Exceptional 8.2% |
| Marshallese | 100.0 /100 | #32 | Exceptional 8.1% |
| Yaqui | 100.0 /100 | #33 | Exceptional 8.1% |
| Alaskan Athabascans | 100.0 /100 | #34 | Exceptional 8.1% |
| Guamanians/Chamorros | 100.0 /100 | #35 | Exceptional 8.1% |
| Norwegians | 100.0 /100 | #36 | Exceptional 8.0% |
| Scandinavians | 100.0 /100 | #37 | Exceptional 8.0% |
| Sioux | 100.0 /100 | #38 | Exceptional 8.0% |
| Spanish Americans | 100.0 /100 | #39 | Exceptional 8.0% |
| Spanish | 100.0 /100 | #40 | Exceptional 7.9% |
| Pima | 100.0 /100 | #41 | Exceptional 7.9% |
| Salvadorans | 100.0 /100 | #42 | Exceptional 7.8% |
| Fijians | 100.0 /100 | #43 | Exceptional 7.8% |
| Bhutanese | 100.0 /100 | #44 | Exceptional 7.8% |