Turkish vs Scandinavian Unemployment Among Ages 35 to 44 years
COMPARE
Turkish
Scandinavian
Unemployment Among Ages 35 to 44 years
Unemployment Among Ages 35 to 44 years Comparison
Turks
Scandinavians
4.3%
UNEMPLOYMENT AMONG AGES 35 TO 44 YEARS
99.3/ 100
METRIC RATING
26th/ 347
METRIC RANK
4.2%
UNEMPLOYMENT AMONG AGES 35 TO 44 YEARS
99.5/ 100
METRIC RATING
22nd/ 347
METRIC RANK
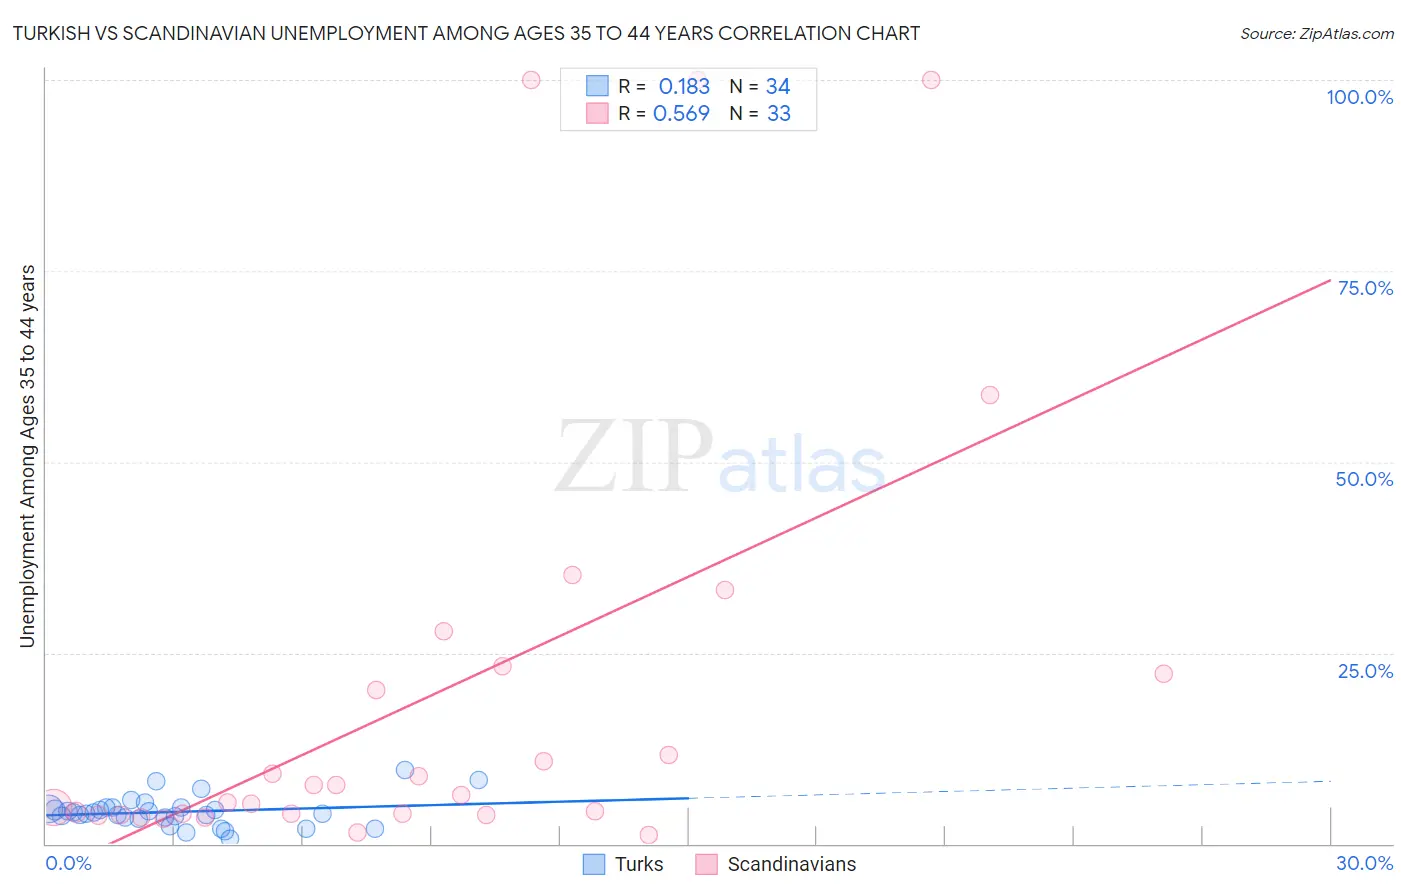
Turkish vs Scandinavian Unemployment Among Ages 35 to 44 years Correlation Chart
The statistical analysis conducted on geographies consisting of 267,944,113 people shows a poor positive correlation between the proportion of Turks and unemployment rate among population between the ages 35 and 44 in the United States with a correlation coefficient (R) of 0.183 and weighted average of 4.3%. Similarly, the statistical analysis conducted on geographies consisting of 451,392,438 people shows a substantial positive correlation between the proportion of Scandinavians and unemployment rate among population between the ages 35 and 44 in the United States with a correlation coefficient (R) of 0.569 and weighted average of 4.2%, a difference of 0.69%.
Unemployment Among Ages 35 to 44 years Correlation Summary
| Measurement | Turkish | Scandinavian |
| Minimum | 0.71% | 1.1% |
| Maximum | 9.6% | 100.0% |
| Range | 8.9% | 98.9% |
| Mean | 4.2% | 19.5% |
| Median | 4.0% | 6.3% |
| Interquartile 25% (IQ1) | 3.4% | 3.8% |
| Interquartile 75% (IQ3) | 4.7% | 22.7% |
| Interquartile Range (IQR) | 1.3% | 18.9% |
| Standard Deviation (Sample) | 1.9% | 28.7% |
| Standard Deviation (Population) | 1.9% | 28.2% |
Demographics Similar to Turks and Scandinavians by Unemployment Among Ages 35 to 44 years
In terms of unemployment among ages 35 to 44 years, the demographic groups most similar to Turks are Assyrian/Chaldean/Syriac (4.3%, a difference of 0.020%), Bulgarian (4.3%, a difference of 0.060%), Immigrants from Japan (4.3%, a difference of 0.090%), European (4.3%, a difference of 0.29%), and Immigrants from Pakistan (4.3%, a difference of 0.36%). Similarly, the demographic groups most similar to Scandinavians are Immigrants from Kuwait (4.3%, a difference of 0.15%), Tlingit-Haida (4.3%, a difference of 0.16%), Paraguayan (4.2%, a difference of 0.26%), Bulgarian (4.3%, a difference of 0.63%), and Assyrian/Chaldean/Syriac (4.3%, a difference of 0.71%).
| Demographics | Rating | Rank | Unemployment Among Ages 35 to 44 years |
| Czechs | 99.9 /100 | #14 | Exceptional 4.1% |
| Tongans | 99.8 /100 | #15 | Exceptional 4.2% |
| Cubans | 99.8 /100 | #16 | Exceptional 4.2% |
| Swedes | 99.8 /100 | #17 | Exceptional 4.2% |
| Latvians | 99.8 /100 | #18 | Exceptional 4.2% |
| Immigrants | Nepal | 99.7 /100 | #19 | Exceptional 4.2% |
| Immigrants | Bolivia | 99.7 /100 | #20 | Exceptional 4.2% |
| Paraguayans | 99.6 /100 | #21 | Exceptional 4.2% |
| Scandinavians | 99.5 /100 | #22 | Exceptional 4.2% |
| Immigrants | Kuwait | 99.5 /100 | #23 | Exceptional 4.3% |
| Tlingit-Haida | 99.5 /100 | #24 | Exceptional 4.3% |
| Bulgarians | 99.3 /100 | #25 | Exceptional 4.3% |
| Turks | 99.3 /100 | #26 | Exceptional 4.3% |
| Assyrians/Chaldeans/Syriacs | 99.3 /100 | #27 | Exceptional 4.3% |
| Immigrants | Japan | 99.3 /100 | #28 | Exceptional 4.3% |
| Europeans | 99.2 /100 | #29 | Exceptional 4.3% |
| Immigrants | Pakistan | 99.2 /100 | #30 | Exceptional 4.3% |
| Carpatho Rusyns | 99.2 /100 | #31 | Exceptional 4.3% |
| Chinese | 99.1 /100 | #32 | Exceptional 4.3% |
| Immigrants | Sri Lanka | 99.1 /100 | #33 | Exceptional 4.3% |
| Jordanians | 99.0 /100 | #34 | Exceptional 4.3% |