Turkish vs Russian 4 or more Vehicles in Household
COMPARE
Turkish
Russian
4 or more Vehicles in Household
4 or more Vehicles in Household Comparison
Turks
Russians
5.8%
4 OR MORE VEHICLES IN HOUSEHOLD
4.1/ 100
METRIC RATING
237th/ 347
METRIC RANK
6.0%
4 OR MORE VEHICLES IN HOUSEHOLD
10.3/ 100
METRIC RATING
220th/ 347
METRIC RANK
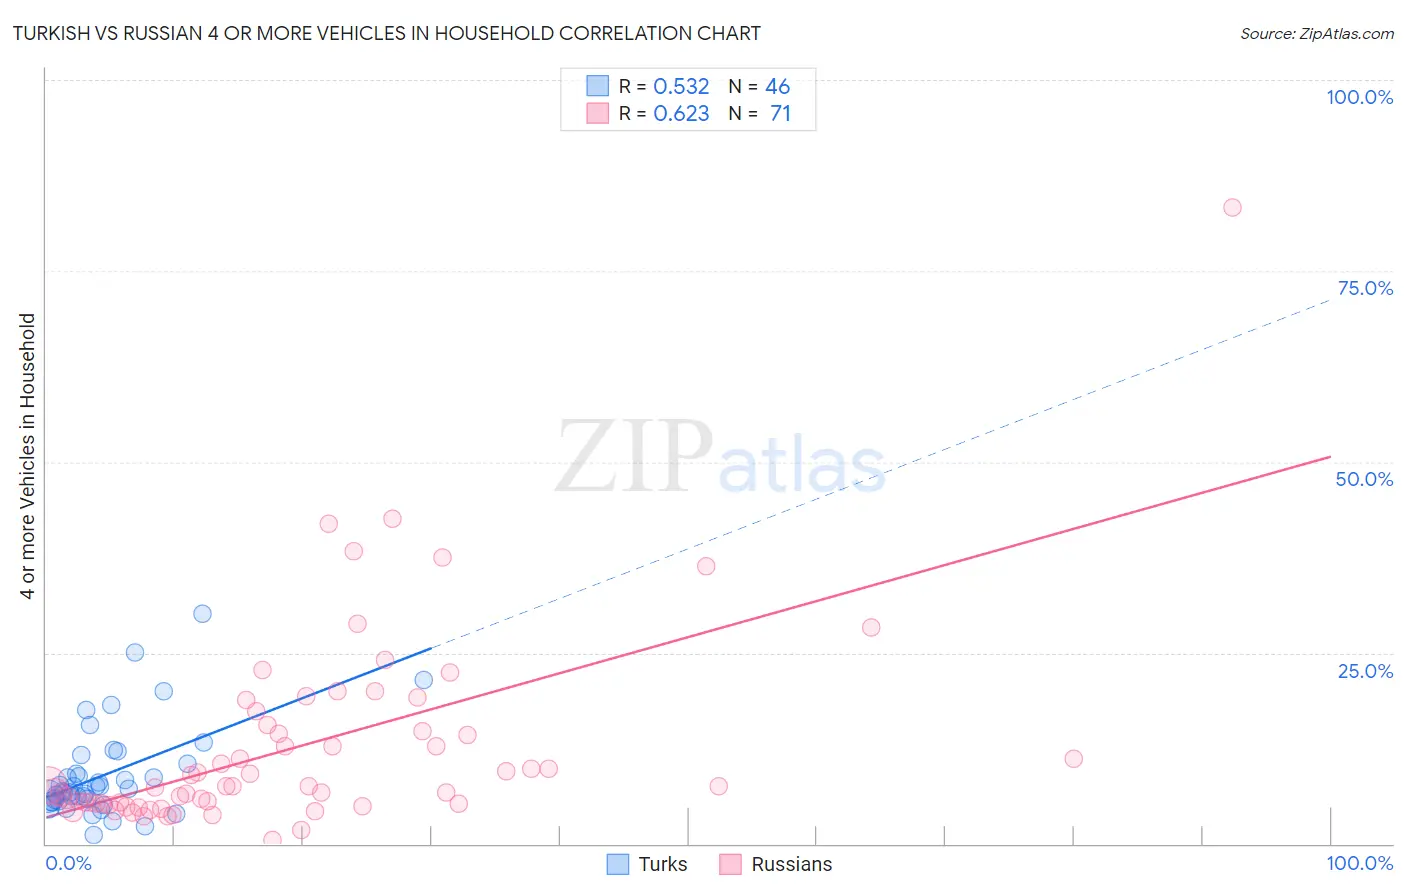
Turkish vs Russian 4 or more Vehicles in Household Correlation Chart
The statistical analysis conducted on geographies consisting of 270,554,311 people shows a substantial positive correlation between the proportion of Turks and percentage of households with 4 or more vehicles available in the United States with a correlation coefficient (R) of 0.532 and weighted average of 5.8%. Similarly, the statistical analysis conducted on geographies consisting of 509,368,397 people shows a significant positive correlation between the proportion of Russians and percentage of households with 4 or more vehicles available in the United States with a correlation coefficient (R) of 0.623 and weighted average of 6.0%, a difference of 2.7%.
4 or more Vehicles in Household Correlation Summary
| Measurement | Turkish | Russian |
| Minimum | 1.1% | 0.51% |
| Maximum | 30.2% | 83.3% |
| Range | 29.1% | 82.8% |
| Mean | 9.1% | 12.8% |
| Median | 7.0% | 7.5% |
| Interquartile 25% (IQ1) | 5.6% | 5.3% |
| Interquartile 75% (IQ3) | 10.5% | 15.6% |
| Interquartile Range (IQR) | 4.9% | 10.3% |
| Standard Deviation (Sample) | 6.0% | 13.0% |
| Standard Deviation (Population) | 5.9% | 12.9% |
Demographics Similar to Turks and Russians by 4 or more Vehicles in Household
In terms of 4 or more vehicles in household, the demographic groups most similar to Turks are Immigrants from Belgium (5.8%, a difference of 0.13%), Immigrants from Eritrea (5.8%, a difference of 0.27%), Immigrants from Hungary (5.8%, a difference of 0.29%), African (5.8%, a difference of 0.31%), and Sierra Leonean (5.9%, a difference of 1.1%). Similarly, the demographic groups most similar to Russians are Immigrants from Italy (6.0%, a difference of 0.19%), Serbian (6.0%, a difference of 0.19%), Immigrants from Moldova (6.0%, a difference of 0.29%), Cajun (6.0%, a difference of 0.33%), and Immigrants from Kenya (6.0%, a difference of 0.33%).
| Demographics | Rating | Rank | 4 or more Vehicles in Household |
| Immigrants | Italy | 11.0 /100 | #218 | Poor 6.0% |
| Serbians | 11.0 /100 | #219 | Poor 6.0% |
| Russians | 10.3 /100 | #220 | Poor 6.0% |
| Immigrants | Moldova | 9.3 /100 | #221 | Tragic 6.0% |
| Cajuns | 9.2 /100 | #222 | Tragic 6.0% |
| Immigrants | Kenya | 9.2 /100 | #223 | Tragic 6.0% |
| Cubans | 9.2 /100 | #224 | Tragic 6.0% |
| Indonesians | 8.9 /100 | #225 | Tragic 6.0% |
| Immigrants | Singapore | 7.9 /100 | #226 | Tragic 5.9% |
| Immigrants | Western Asia | 7.8 /100 | #227 | Tragic 5.9% |
| Immigrants | Uganda | 7.5 /100 | #228 | Tragic 5.9% |
| Eastern Europeans | 6.8 /100 | #229 | Tragic 5.9% |
| Immigrants | Malaysia | 6.7 /100 | #230 | Tragic 5.9% |
| Immigrants | Switzerland | 6.4 /100 | #231 | Tragic 5.9% |
| Immigrants | Argentina | 6.0 /100 | #232 | Tragic 5.9% |
| Sierra Leoneans | 6.0 /100 | #233 | Tragic 5.9% |
| Africans | 4.6 /100 | #234 | Tragic 5.8% |
| Immigrants | Hungary | 4.6 /100 | #235 | Tragic 5.8% |
| Immigrants | Eritrea | 4.5 /100 | #236 | Tragic 5.8% |
| Turks | 4.1 /100 | #237 | Tragic 5.8% |
| Immigrants | Belgium | 4.0 /100 | #238 | Tragic 5.8% |