Turkish vs Scandinavian 9th Grade
COMPARE
Turkish
Scandinavian
9th Grade
9th Grade Comparison
Turks
Scandinavians
95.8%
9TH GRADE
99.5/ 100
METRIC RATING
72nd/ 347
METRIC RANK
96.5%
9TH GRADE
100.0/ 100
METRIC RATING
18th/ 347
METRIC RANK
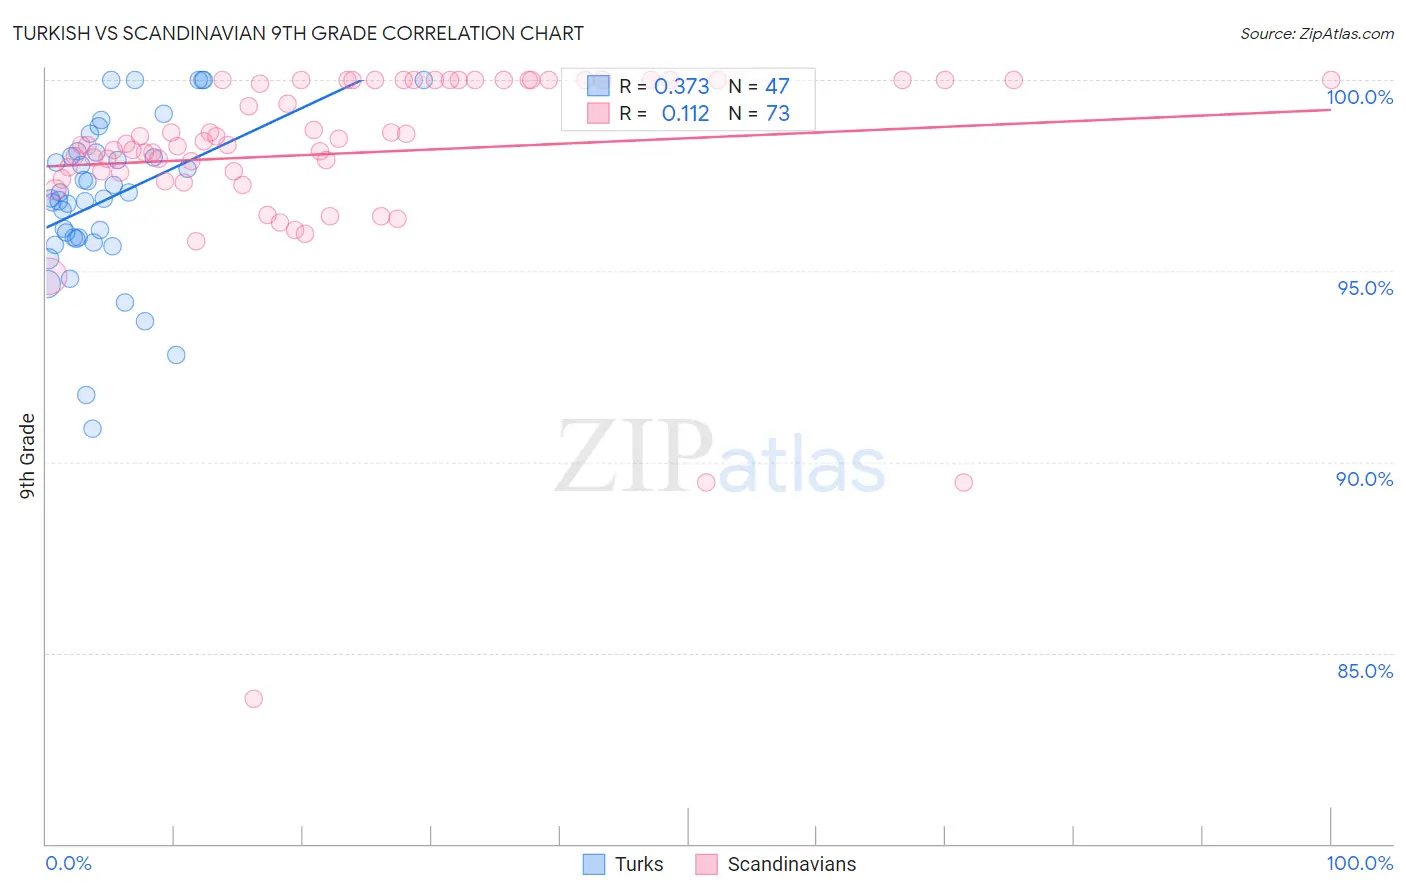
Turkish vs Scandinavian 9th Grade Correlation Chart
The statistical analysis conducted on geographies consisting of 271,864,133 people shows a mild positive correlation between the proportion of Turks and percentage of population with at least 9th grade education in the United States with a correlation coefficient (R) of 0.373 and weighted average of 95.8%. Similarly, the statistical analysis conducted on geographies consisting of 472,660,435 people shows a poor positive correlation between the proportion of Scandinavians and percentage of population with at least 9th grade education in the United States with a correlation coefficient (R) of 0.112 and weighted average of 96.5%, a difference of 0.68%.
9th Grade Correlation Summary
| Measurement | Turkish | Scandinavian |
| Minimum | 90.9% | 83.8% |
| Maximum | 100.0% | 100.0% |
| Range | 9.1% | 16.2% |
| Mean | 96.9% | 98.1% |
| Median | 96.9% | 98.3% |
| Interquartile 25% (IQ1) | 95.9% | 97.6% |
| Interquartile 75% (IQ3) | 98.1% | 100.0% |
| Interquartile Range (IQR) | 2.3% | 2.4% |
| Standard Deviation (Sample) | 2.1% | 2.6% |
| Standard Deviation (Population) | 2.1% | 2.6% |
Similar Demographics by 9th Grade
Demographics Similar to Turks by 9th Grade
In terms of 9th grade, the demographic groups most similar to Turks are Immigrants from Belgium (95.8%, a difference of 0.0%), Immigrants from Singapore (95.8%, a difference of 0.0%), Immigrants from Australia (95.8%, a difference of 0.010%), Thai (95.8%, a difference of 0.010%), and Immigrants from Ireland (95.8%, a difference of 0.020%).
| Demographics | Rating | Rank | 9th Grade |
| Immigrants | England | 99.6 /100 | #65 | Exceptional 95.9% |
| Immigrants | Netherlands | 99.6 /100 | #66 | Exceptional 95.8% |
| Cypriots | 99.6 /100 | #67 | Exceptional 95.8% |
| Immigrants | Ireland | 99.6 /100 | #68 | Exceptional 95.8% |
| Immigrants | Lithuania | 99.6 /100 | #69 | Exceptional 95.8% |
| Immigrants | Australia | 99.5 /100 | #70 | Exceptional 95.8% |
| Immigrants | Belgium | 99.5 /100 | #71 | Exceptional 95.8% |
| Turks | 99.5 /100 | #72 | Exceptional 95.8% |
| Immigrants | Singapore | 99.5 /100 | #73 | Exceptional 95.8% |
| Thais | 99.5 /100 | #74 | Exceptional 95.8% |
| Inupiat | 99.5 /100 | #75 | Exceptional 95.8% |
| Immigrants | Sweden | 99.5 /100 | #76 | Exceptional 95.8% |
| Whites/Caucasians | 99.4 /100 | #77 | Exceptional 95.8% |
| Immigrants | South Africa | 99.4 /100 | #78 | Exceptional 95.8% |
| Romanians | 99.3 /100 | #79 | Exceptional 95.7% |
Demographics Similar to Scandinavians by 9th Grade
In terms of 9th grade, the demographic groups most similar to Scandinavians are Dutch (96.5%, a difference of 0.020%), Welsh (96.4%, a difference of 0.040%), Italian (96.4%, a difference of 0.040%), Alaskan Athabascan (96.4%, a difference of 0.050%), and European (96.4%, a difference of 0.060%).
| Demographics | Rating | Rank | 9th Grade |
| Finns | 100.0 /100 | #11 | Exceptional 96.6% |
| English | 100.0 /100 | #12 | Exceptional 96.6% |
| Danes | 100.0 /100 | #13 | Exceptional 96.5% |
| Scottish | 100.0 /100 | #14 | Exceptional 96.5% |
| Irish | 100.0 /100 | #15 | Exceptional 96.5% |
| Croatians | 100.0 /100 | #16 | Exceptional 96.5% |
| Dutch | 100.0 /100 | #17 | Exceptional 96.5% |
| Scandinavians | 100.0 /100 | #18 | Exceptional 96.5% |
| Welsh | 100.0 /100 | #19 | Exceptional 96.4% |
| Italians | 100.0 /100 | #20 | Exceptional 96.4% |
| Alaskan Athabascans | 100.0 /100 | #21 | Exceptional 96.4% |
| Europeans | 100.0 /100 | #22 | Exceptional 96.4% |
| Czechs | 100.0 /100 | #23 | Exceptional 96.4% |
| Latvians | 100.0 /100 | #24 | Exceptional 96.4% |
| French | 100.0 /100 | #25 | Exceptional 96.3% |