Sri Lankan vs Immigrants from Moldova Master's Degree

COMPARE

Sri Lankan
Race
Ancestry
AfghanAfricanAlaska NativeAlaskan AthabascanAlbanianAleutAlsatianAmericanApacheArabArapahoArgentineanArmenianAssyrian/Chaldean/SyriacAustralianAustrianBahamianBangladeshiBarbadianBasqueBelgianBelizeanBermudanBhutaneseBlackfeetBolivianBrazilianBritishBritish West IndianBulgarianBurmeseCajunCambodianCanadianCape VerdeanCarpatho RusynCelticCentral AmericanCentral American IndianCherokeeCheyenneChickasawChileanChineseChippewaChoctawColombianColvilleComancheCosta RicanCreeCreekCroatianCrowCubanCypriotCzechCzechoslovakianDanishDelawareDominicanDutchDutch West IndianEastern EuropeanEcuadorianEgyptianEnglishEstonianEthiopianEuropeanFijianFilipinoFinnishFrenchFrench American IndianFrench CanadianGermanGerman RussianGhanaianGreekGuamanian/ChamorroGuatemalanGuyaneseHaitianHmongHonduranHopiHoumaHungarianIcelanderIndian (Asian)IndonesianInupiatIranianIraqiIrishIroquoisIsraeliItalianJamaicanJapaneseJordanianKenyanKiowaKoreanLaotianLatvianLebaneseLiberianLithuanianLumbeeLuxembourgerMacedonianMalaysianMalteseMarshalleseMenomineeMexicanMexican American IndianMongolianMoroccanNative HawaiianNavajoNepaleseNew ZealanderNicaraguanNigerianNorthern EuropeanNorwegianOkinawanOsageOttawaPaiutePakistaniPalestinianPanamanianParaguayanPennsylvania GermanPeruvianPimaPolishPortuguesePotawatomiPuebloPuerto RicanPuget Sound SalishRomanianRussianSalvadoranSamoanScandinavianScotch-IrishScottishSeminoleSenegaleseSerbianShoshoneSierra LeoneanSiouxSlavicSlovakSloveneSomaliSouth AfricanSouth AmericanSouth American IndianSoviet UnionSpaniardSpanishSpanish AmericanSpanish American IndianSri LankanSubsaharan AfricanSudaneseSwedishSwissSyrianTaiwaneseThaiTlingit-HaidaTohono O'OdhamTonganTrinidadian and TobagonianTsimshianTurkishU.S. Virgin IslanderUgandanUkrainianUruguayanUteVenezuelanVietnameseWelshWest IndianYakamaYaquiYugoslavianYumanYup'ikZimbabwean
Immigration
NonimmigrantsImmigrantsAfghanistanAfricaAlbaniaArgentinaArmeniaAsiaAustraliaAustriaBahamasBangladeshBarbadosBelarusBelgiumBelizeBoliviaBosnia and HerzegovinaBrazilBulgariaBurma/MyanmarCabo VerdeCambodiaCameroonCanadaCaribbeanCentral AmericaChileChinaColombiaCongoCosta RicaCroatiaCubaCzechoslovakiaDenmarkDominicaDominican RepublicEastern AfricaEastern AsiaEastern EuropeEcuadorEgyptEl SalvadorEnglandEritreaEthiopiaEuropeFijiFranceGermanyGhanaGreeceGrenadaGuatemalaGuyanaHaitiHondurasHong KongHungaryIndiaIndonesiaIranIraqIrelandIsraelItalyJamaicaJapanJordanKazakhstanKenyaKoreaKuwaitLaosLatin AmericaLatviaLebanonLiberiaLithuaniaMalaysiaMexicoMicronesiaMiddle AfricaMoroccoNepalNetherlandsNicaraguaNigeriaNorth AmericaNorth MacedoniaNorthern AfricaNorthern EuropeNorwayOceaniaPakistanPanamaPeruPhilippinesPolandPortugalRomaniaRussiaSaudi ArabiaScotlandSenegalSerbiaSierra LeoneSingaporeSomaliaSouth AfricaSouth AmericaSouth Central AsiaSouth Eastern AsiaSouthern EuropeSpainSri LankaSt. Vincent and the GrenadinesSudanSwedenSwitzerlandSyriaTaiwanThailandTrinidad and TobagoTurkeyUgandaUkraineUruguayUzbekistanVenezuelaVietnamWest IndiesWestern AfricaWestern AsiaWestern EuropeYemenZaireZimbabweAzores
Immigrants from Moldova
Race
Ancestry
AfghanAfricanAlaska NativeAlaskan AthabascanAlbanianAleutAlsatianAmericanApacheArabArapahoArgentineanArmenianAssyrian/Chaldean/SyriacAustralianAustrianBahamianBangladeshiBarbadianBasqueBelgianBelizeanBermudanBhutaneseBlackfeetBolivianBrazilianBritishBritish West IndianBulgarianBurmeseCajunCambodianCanadianCape VerdeanCarpatho RusynCelticCentral AmericanCentral American IndianCherokeeCheyenneChickasawChileanChineseChippewaChoctawColombianColvilleComancheCosta RicanCreeCreekCroatianCrowCubanCypriotCzechCzechoslovakianDanishDelawareDominicanDutchDutch West IndianEastern EuropeanEcuadorianEgyptianEnglishEstonianEthiopianEuropeanFijianFilipinoFinnishFrenchFrench American IndianFrench CanadianGermanGerman RussianGhanaianGreekGuamanian/ChamorroGuatemalanGuyaneseHaitianHmongHonduranHopiHoumaHungarianIcelanderIndian (Asian)IndonesianInupiatIranianIraqiIrishIroquoisIsraeliItalianJamaicanJapaneseJordanianKenyanKiowaKoreanLaotianLatvianLebaneseLiberianLithuanianLumbeeLuxembourgerMacedonianMalaysianMalteseMarshalleseMenomineeMexicanMexican American IndianMongolianMoroccanNative HawaiianNavajoNepaleseNew ZealanderNicaraguanNigerianNorthern EuropeanNorwegianOkinawanOsageOttawaPaiutePakistaniPalestinianPanamanianParaguayanPennsylvania GermanPeruvianPimaPolishPortuguesePotawatomiPuebloPuerto RicanPuget Sound SalishRomanianRussianSalvadoranSamoanScandinavianScotch-IrishScottishSeminoleSenegaleseSerbianShoshoneSierra LeoneanSiouxSlavicSlovakSloveneSomaliSouth AfricanSouth AmericanSouth American IndianSoviet UnionSpaniardSpanishSpanish AmericanSpanish American IndianSubsaharan AfricanSudaneseSwedishSwissSyrianTaiwaneseThaiTlingit-HaidaTohono O'OdhamTonganTrinidadian and TobagonianTsimshianTurkishU.S. Virgin IslanderUgandanUkrainianUruguayanUteVenezuelanVietnameseWelshWest IndianYakamaYaquiYugoslavianYumanYup'ikZimbabwean
Immigration
NonimmigrantsImmigrantsAfghanistanAfricaAlbaniaArgentinaArmeniaAsiaAustraliaAustriaBahamasBangladeshBarbadosBelarusBelgiumBelizeBoliviaBosnia and HerzegovinaBrazilBulgariaBurma/MyanmarCabo VerdeCambodiaCameroonCanadaCaribbeanCentral AmericaChileChinaColombiaCongoCosta RicaCroatiaCubaCzechoslovakiaDenmarkDominicaDominican RepublicEastern AfricaEastern AsiaEastern EuropeEcuadorEgyptEl SalvadorEnglandEritreaEthiopiaEuropeFijiFranceGermanyGhanaGreeceGrenadaGuatemalaGuyanaHaitiHondurasHong KongHungaryIndiaIndonesiaIranIraqIrelandIsraelItalyJamaicaJapanJordanKazakhstanKenyaKoreaKuwaitLaosLatin AmericaLatviaLebanonLiberiaLithuaniaMalaysiaMexicoMicronesiaMiddle AfricaMoldovaMoroccoNepalNetherlandsNicaraguaNigeriaNorth AmericaNorth MacedoniaNorthern AfricaNorthern EuropeNorwayOceaniaPakistanPanamaPeruPhilippinesPolandPortugalRomaniaRussiaSaudi ArabiaScotlandSenegalSerbiaSierra LeoneSingaporeSomaliaSouth AfricaSouth AmericaSouth Central AsiaSouth Eastern AsiaSouthern EuropeSpainSri LankaSt. Vincent and the GrenadinesSudanSwedenSwitzerlandSyriaTaiwanThailandTrinidad and TobagoTurkeyUgandaUkraineUruguayUzbekistanVenezuelaVietnamWest IndiesWestern AfricaWestern AsiaWestern EuropeYemenZaireZimbabweAzores
Master's Degree
Income
Poverty
Unemployment
Labor Participation
Family Structure
Vehicle Availability
Education Level
Disability

Master's Degree Comparison

Sri Lankans

Immigrants from Moldova

Fair
Exceptional
14.7%
MASTER'S DEGREE
39.6/ 100
METRIC RATING
183rd/ 347
METRIC RANK
16.6%
MASTER'S DEGREE
97.2/ 100
METRIC RATING
117th/ 347
METRIC RANK

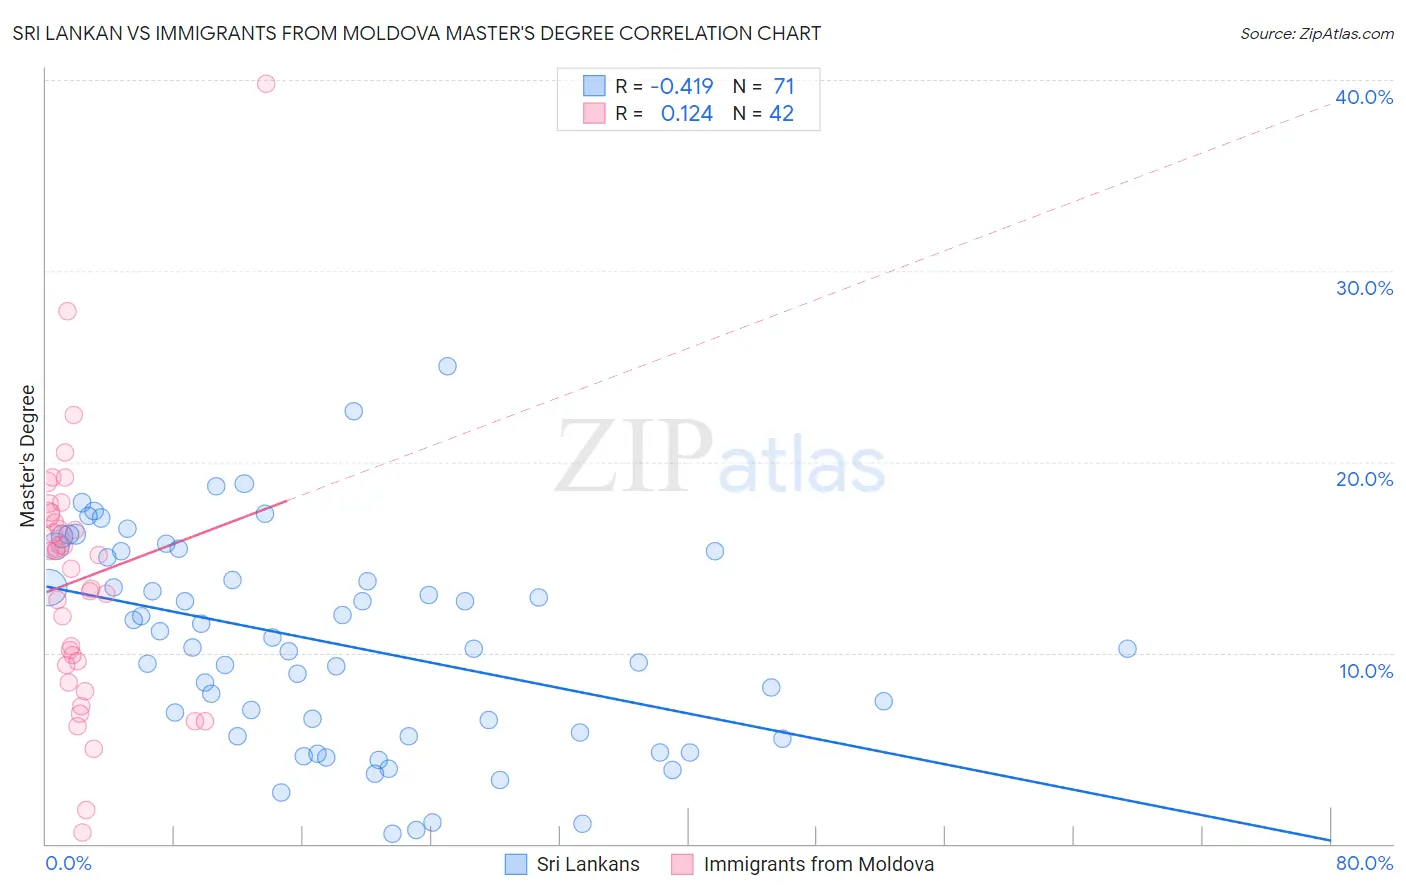
Sri Lankan vs Immigrants from Moldova Master's Degree Correlation Chart

The statistical analysis conducted on geographies consisting of 440,331,802 people shows a moderate negative correlation between the proportion of Sri Lankans and percentage of population with at least master's degree education in the United States with a correlation coefficient (R) of -0.419 and weighted average of 14.7%. Similarly, the statistical analysis conducted on geographies consisting of 124,394,558 people shows a poor positive correlation between the proportion of Immigrants from Moldova and percentage of population with at least master's degree education in the United States with a correlation coefficient (R) of 0.124 and weighted average of 16.6%, a difference of 12.9%.
Sri Lankan vs Immigrants from Moldova Master's Degree

Master's Degree Correlation Summary

MeasurementSri LankanImmigrants from Moldova
Minimum0.51%0.61%
Maximum25.0%39.8%
Range24.5%39.2%
Mean10.5%13.8%
Median10.3%14.7%
Interquartile 25% (IQ1)5.7%9.4%
Interquartile 75% (IQ3)15.3%17.2%
Interquartile Range (IQR)9.7%7.9%
Standard Deviation (Sample)5.5%7.0%
Standard Deviation (Population)5.4%6.9%

Similar Demographics by Master's Degree

Demographics Similar to Sri Lankans by Master's Degree

In terms of master's degree, the demographic groups most similar to Sri Lankans are Immigrants from Zaire (14.7%, a difference of 0.020%), Czech (14.7%, a difference of 0.10%), Barbadian (14.7%, a difference of 0.18%), Swiss (14.7%, a difference of 0.20%), and Celtic (14.8%, a difference of 0.22%).
DemographicsRating | RankMaster's Degree
Nigerians
48.6
/100
|
#176
Average
14.9%
Immigrants | Colombia
48.3
/100
|
#177
Average
14.9%
English
45.0
/100
|
#178
Average
14.8%
Immigrants | Iraq
41.3
/100
|
#179
Average
14.8%
Celtics
41.3
/100
|
#180
Average
14.8%
Swiss
41.1
/100
|
#181
Average
14.7%
Czechs
40.4
/100
|
#182
Average
14.7%
Sri Lankans
39.6
/100
|
#183
Fair
14.7%
Immigrants | Zaire
39.5
/100
|
#184
Fair
14.7%
Barbadians
38.3
/100
|
#185
Fair
14.7%
Immigrants | Oceania
37.1
/100
|
#186
Fair
14.7%
Basques
36.5
/100
|
#187
Fair
14.7%
Immigrants | Costa Rica
36.2
/100
|
#188
Fair
14.7%
Immigrants | Immigrants
36.0
/100
|
#189
Fair
14.6%
Spaniards
35.8
/100
|
#190
Fair
14.6%

Demographics Similar to Immigrants from Moldova by Master's Degree

In terms of master's degree, the demographic groups most similar to Immigrants from Moldova are Immigrants from Southern Europe (16.6%, a difference of 0.010%), Immigrants from Uganda (16.6%, a difference of 0.13%), Brazilian (16.5%, a difference of 0.42%), Northern European (16.7%, a difference of 0.43%), and Arab (16.7%, a difference of 0.50%).
DemographicsRating | RankMaster's Degree
Immigrants | Chile
98.0
/100
|
#110
Exceptional
16.8%
Austrians
97.8
/100
|
#111
Exceptional
16.7%
Macedonians
97.7
/100
|
#112
Exceptional
16.7%
Arabs
97.7
/100
|
#113
Exceptional
16.7%
Northern Europeans
97.6
/100
|
#114
Exceptional
16.7%
Immigrants | Uganda
97.3
/100
|
#115
Exceptional
16.6%
Immigrants | Southern Europe
97.2
/100
|
#116
Exceptional
16.6%
Immigrants | Moldova
97.2
/100
|
#117
Exceptional
16.6%
Brazilians
96.8
/100
|
#118
Exceptional
16.5%
Jordanians
96.5
/100
|
#119
Exceptional
16.5%
Lebanese
96.4
/100
|
#120
Exceptional
16.5%
Afghans
96.2
/100
|
#121
Exceptional
16.5%
British
95.6
/100
|
#122
Exceptional
16.4%
Croatians
95.6
/100
|
#123
Exceptional
16.4%
Immigrants | Eritrea
95.5
/100
|
#124
Exceptional
16.4%