Sierra Leonean vs Estonian 3 or more Vehicles in Household
COMPARE
Sierra Leonean
Estonian
3 or more Vehicles in Household
3 or more Vehicles in Household Comparison
Sierra Leoneans
Estonians
18.3%
3 OR MORE VEHICLES IN HOUSEHOLD
3.9/ 100
METRIC RATING
235th/ 347
METRIC RANK
19.7%
3 OR MORE VEHICLES IN HOUSEHOLD
63.2/ 100
METRIC RATING
162nd/ 347
METRIC RANK
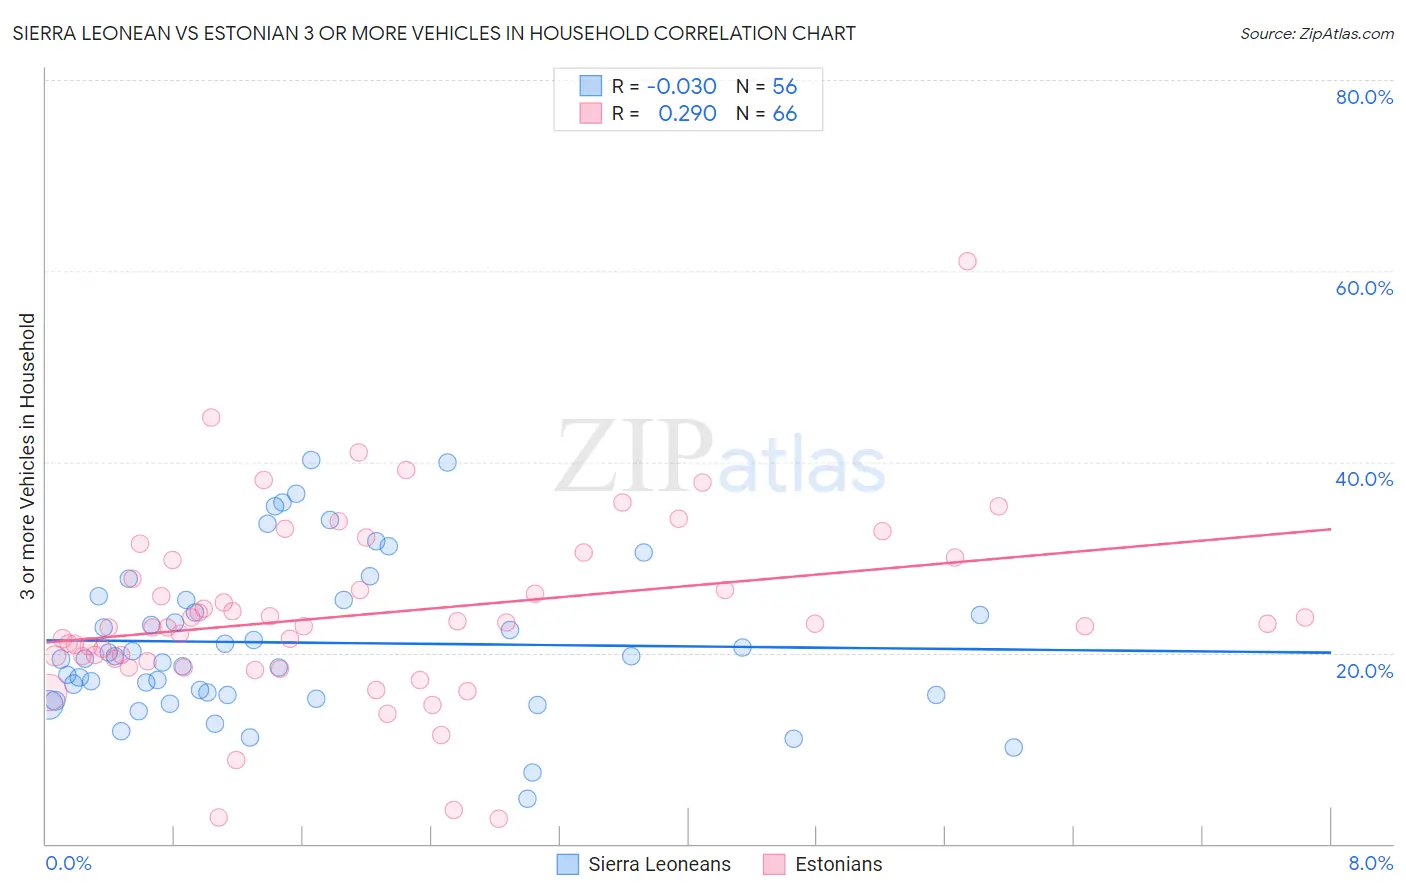
Sierra Leonean vs Estonian 3 or more Vehicles in Household Correlation Chart
The statistical analysis conducted on geographies consisting of 83,340,667 people shows no correlation between the proportion of Sierra Leoneans and percentage of households with 3 or more vehicles available in the United States with a correlation coefficient (R) of -0.030 and weighted average of 18.3%. Similarly, the statistical analysis conducted on geographies consisting of 123,487,614 people shows a weak positive correlation between the proportion of Estonians and percentage of households with 3 or more vehicles available in the United States with a correlation coefficient (R) of 0.290 and weighted average of 19.7%, a difference of 7.5%.
3 or more Vehicles in Household Correlation Summary
| Measurement | Sierra Leonean | Estonian |
| Minimum | 4.7% | 2.6% |
| Maximum | 40.1% | 61.0% |
| Range | 35.5% | 58.5% |
| Mean | 21.1% | 24.1% |
| Median | 19.5% | 23.0% |
| Interquartile 25% (IQ1) | 15.6% | 19.4% |
| Interquartile 75% (IQ3) | 25.5% | 29.8% |
| Interquartile Range (IQR) | 10.0% | 10.3% |
| Standard Deviation (Sample) | 8.1% | 9.7% |
| Standard Deviation (Population) | 8.0% | 9.6% |
Similar Demographics by 3 or more Vehicles in Household
Demographics Similar to Sierra Leoneans by 3 or more Vehicles in Household
In terms of 3 or more vehicles in household, the demographic groups most similar to Sierra Leoneans are Immigrants from Malaysia (18.3%, a difference of 0.18%), Indonesian (18.3%, a difference of 0.23%), Immigrants from North Macedonia (18.4%, a difference of 0.28%), Honduran (18.4%, a difference of 0.34%), and Immigrants from Uganda (18.4%, a difference of 0.36%).
| Demographics | Rating | Rank | 3 or more Vehicles in Household |
| Turks | 5.4 /100 | #228 | Tragic 18.4% |
| Immigrants | Switzerland | 5.0 /100 | #229 | Tragic 18.4% |
| Immigrants | Western Asia | 4.8 /100 | #230 | Tragic 18.4% |
| Immigrants | Belgium | 4.8 /100 | #231 | Tragic 18.4% |
| Immigrants | Uganda | 4.6 /100 | #232 | Tragic 18.4% |
| Hondurans | 4.6 /100 | #233 | Tragic 18.4% |
| Immigrants | North Macedonia | 4.4 /100 | #234 | Tragic 18.4% |
| Sierra Leoneans | 3.9 /100 | #235 | Tragic 18.3% |
| Immigrants | Malaysia | 3.6 /100 | #236 | Tragic 18.3% |
| Indonesians | 3.5 /100 | #237 | Tragic 18.3% |
| Immigrants | Honduras | 3.1 /100 | #238 | Tragic 18.2% |
| Immigrants | Middle Africa | 3.1 /100 | #239 | Tragic 18.2% |
| Immigrants | China | 2.9 /100 | #240 | Tragic 18.2% |
| Africans | 2.7 /100 | #241 | Tragic 18.2% |
| Hopi | 2.5 /100 | #242 | Tragic 18.2% |
Demographics Similar to Estonians by 3 or more Vehicles in Household
In terms of 3 or more vehicles in household, the demographic groups most similar to Estonians are Chilean (19.7%, a difference of 0.020%), Yugoslavian (19.7%, a difference of 0.030%), Immigrants from Costa Rica (19.7%, a difference of 0.11%), Immigrants from Guatemala (19.7%, a difference of 0.19%), and Immigrants from Cameroon (19.7%, a difference of 0.19%).
| Demographics | Rating | Rank | 3 or more Vehicles in Household |
| Tlingit-Haida | 73.4 /100 | #155 | Good 19.9% |
| Thais | 71.1 /100 | #156 | Good 19.8% |
| Hungarians | 70.5 /100 | #157 | Good 19.8% |
| Armenians | 68.8 /100 | #158 | Good 19.8% |
| Immigrants | Pakistan | 68.2 /100 | #159 | Good 19.8% |
| Immigrants | Lebanon | 67.6 /100 | #160 | Good 19.8% |
| Immigrants | Guatemala | 65.6 /100 | #161 | Good 19.7% |
| Estonians | 63.2 /100 | #162 | Good 19.7% |
| Chileans | 63.0 /100 | #163 | Good 19.7% |
| Yugoslavians | 62.9 /100 | #164 | Good 19.7% |
| Immigrants | Costa Rica | 61.9 /100 | #165 | Good 19.7% |
| Immigrants | Cameroon | 60.9 /100 | #166 | Good 19.7% |
| Ukrainians | 58.9 /100 | #167 | Average 19.6% |
| Peruvians | 58.8 /100 | #168 | Average 19.6% |
| Immigrants | Denmark | 57.6 /100 | #169 | Average 19.6% |