Immigrants from Uruguay vs Estonian 3 or more Vehicles in Household
COMPARE
Immigrants from Uruguay
Estonian
3 or more Vehicles in Household
3 or more Vehicles in Household Comparison
Immigrants from Uruguay
Estonians
17.1%
3 OR MORE VEHICLES IN HOUSEHOLD
0.2/ 100
METRIC RATING
288th/ 347
METRIC RANK
19.7%
3 OR MORE VEHICLES IN HOUSEHOLD
63.2/ 100
METRIC RATING
162nd/ 347
METRIC RANK
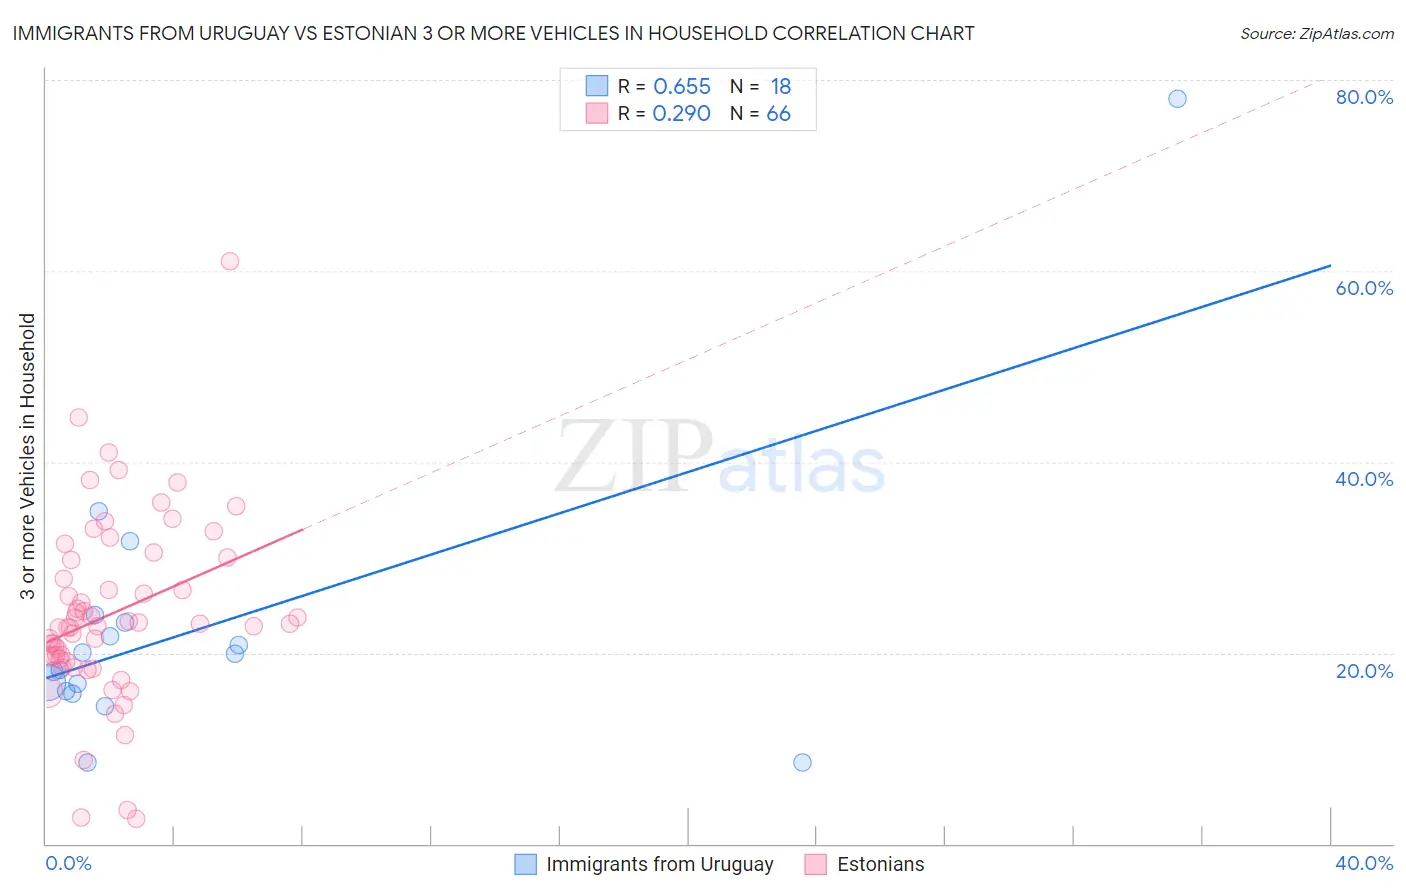
Immigrants from Uruguay vs Estonian 3 or more Vehicles in Household Correlation Chart
The statistical analysis conducted on geographies consisting of 133,238,313 people shows a significant positive correlation between the proportion of Immigrants from Uruguay and percentage of households with 3 or more vehicles available in the United States with a correlation coefficient (R) of 0.655 and weighted average of 17.1%. Similarly, the statistical analysis conducted on geographies consisting of 123,487,614 people shows a weak positive correlation between the proportion of Estonians and percentage of households with 3 or more vehicles available in the United States with a correlation coefficient (R) of 0.290 and weighted average of 19.7%, a difference of 15.1%.
3 or more Vehicles in Household Correlation Summary
| Measurement | Immigrants from Uruguay | Estonian |
| Minimum | 8.6% | 2.6% |
| Maximum | 78.0% | 61.0% |
| Range | 69.5% | 58.5% |
| Mean | 22.6% | 24.1% |
| Median | 19.0% | 23.0% |
| Interquartile 25% (IQ1) | 16.0% | 19.4% |
| Interquartile 75% (IQ3) | 23.1% | 29.8% |
| Interquartile Range (IQR) | 7.1% | 10.3% |
| Standard Deviation (Sample) | 15.3% | 9.7% |
| Standard Deviation (Population) | 14.9% | 9.6% |
Similar Demographics by 3 or more Vehicles in Household
Demographics Similar to Immigrants from Uruguay by 3 or more Vehicles in Household
In terms of 3 or more vehicles in household, the demographic groups most similar to Immigrants from Uruguay are Immigrants from Liberia (17.1%, a difference of 0.070%), Immigrants from Brazil (17.1%, a difference of 0.090%), Menominee (17.2%, a difference of 0.39%), Immigrants from Croatia (17.2%, a difference of 0.45%), and Liberian (17.0%, a difference of 0.64%).
| Demographics | Rating | Rank | 3 or more Vehicles in Household |
| Immigrants | Latvia | 0.3 /100 | #281 | Tragic 17.4% |
| Immigrants | Ireland | 0.3 /100 | #282 | Tragic 17.3% |
| Blacks/African Americans | 0.3 /100 | #283 | Tragic 17.3% |
| Immigrants | Colombia | 0.3 /100 | #284 | Tragic 17.3% |
| Immigrants | Croatia | 0.2 /100 | #285 | Tragic 17.2% |
| Menominee | 0.2 /100 | #286 | Tragic 17.2% |
| Immigrants | Brazil | 0.2 /100 | #287 | Tragic 17.1% |
| Immigrants | Uruguay | 0.2 /100 | #288 | Tragic 17.1% |
| Immigrants | Liberia | 0.1 /100 | #289 | Tragic 17.1% |
| Liberians | 0.1 /100 | #290 | Tragic 17.0% |
| Immigrants | Congo | 0.1 /100 | #291 | Tragic 17.0% |
| Immigrants | Spain | 0.1 /100 | #292 | Tragic 17.0% |
| Bahamians | 0.1 /100 | #293 | Tragic 16.9% |
| Immigrants | Western Africa | 0.1 /100 | #294 | Tragic 16.9% |
| Immigrants | Russia | 0.1 /100 | #295 | Tragic 16.9% |
Demographics Similar to Estonians by 3 or more Vehicles in Household
In terms of 3 or more vehicles in household, the demographic groups most similar to Estonians are Chilean (19.7%, a difference of 0.020%), Yugoslavian (19.7%, a difference of 0.030%), Immigrants from Costa Rica (19.7%, a difference of 0.11%), Immigrants from Guatemala (19.7%, a difference of 0.19%), and Immigrants from Cameroon (19.7%, a difference of 0.19%).
| Demographics | Rating | Rank | 3 or more Vehicles in Household |
| Tlingit-Haida | 73.4 /100 | #155 | Good 19.9% |
| Thais | 71.1 /100 | #156 | Good 19.8% |
| Hungarians | 70.5 /100 | #157 | Good 19.8% |
| Armenians | 68.8 /100 | #158 | Good 19.8% |
| Immigrants | Pakistan | 68.2 /100 | #159 | Good 19.8% |
| Immigrants | Lebanon | 67.6 /100 | #160 | Good 19.8% |
| Immigrants | Guatemala | 65.6 /100 | #161 | Good 19.7% |
| Estonians | 63.2 /100 | #162 | Good 19.7% |
| Chileans | 63.0 /100 | #163 | Good 19.7% |
| Yugoslavians | 62.9 /100 | #164 | Good 19.7% |
| Immigrants | Costa Rica | 61.9 /100 | #165 | Good 19.7% |
| Immigrants | Cameroon | 60.9 /100 | #166 | Good 19.7% |
| Ukrainians | 58.9 /100 | #167 | Average 19.6% |
| Peruvians | 58.8 /100 | #168 | Average 19.6% |
| Immigrants | Denmark | 57.6 /100 | #169 | Average 19.6% |