Ghanaian vs Estonian 3 or more Vehicles in Household
COMPARE
Ghanaian
Estonian
3 or more Vehicles in Household
3 or more Vehicles in Household Comparison
Ghanaians
Estonians
16.4%
3 OR MORE VEHICLES IN HOUSEHOLD
0.0/ 100
METRIC RATING
304th/ 347
METRIC RANK
19.7%
3 OR MORE VEHICLES IN HOUSEHOLD
63.2/ 100
METRIC RATING
162nd/ 347
METRIC RANK
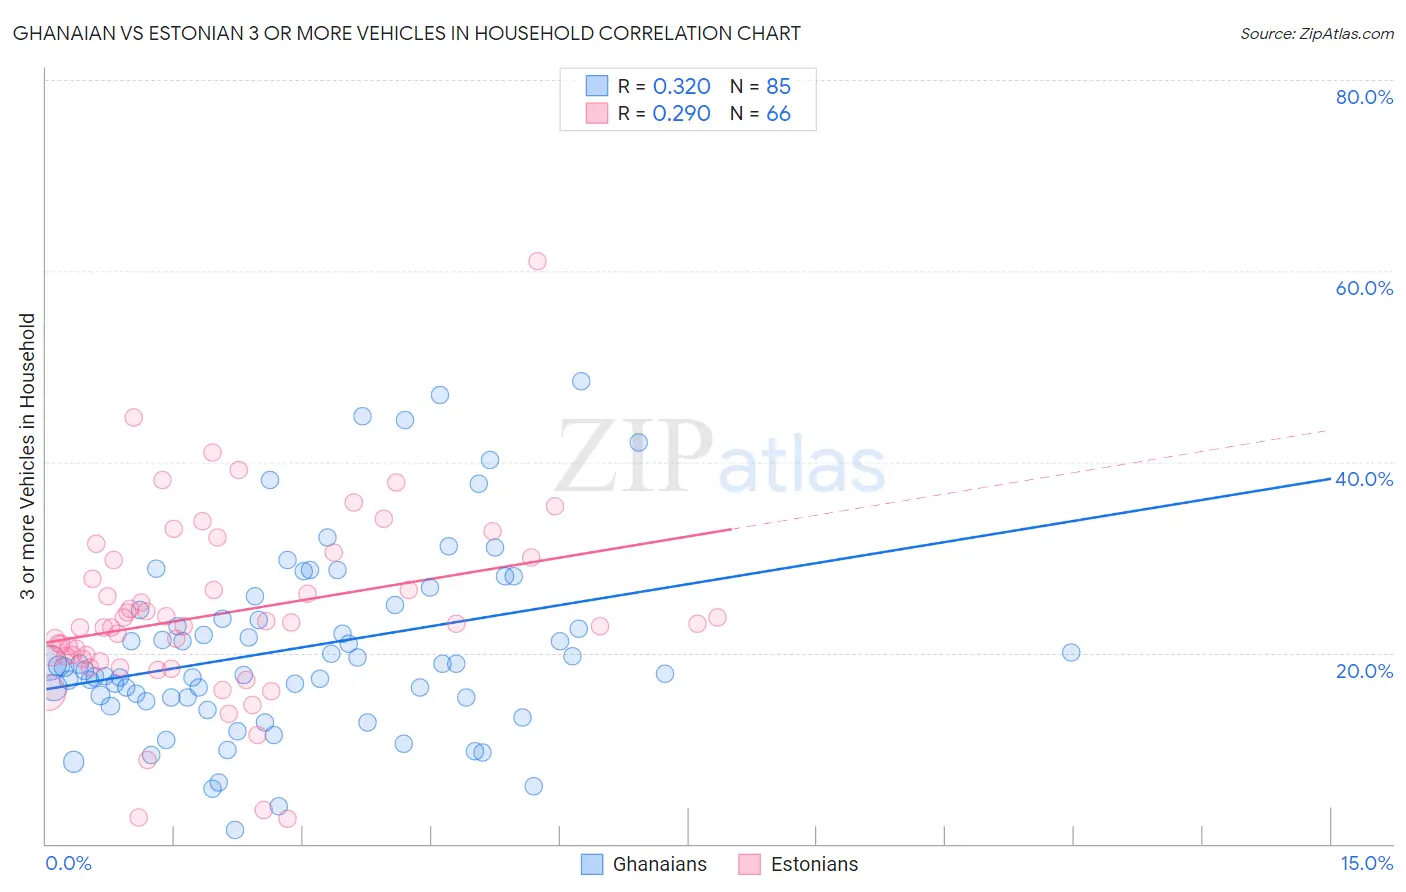
Ghanaian vs Estonian 3 or more Vehicles in Household Correlation Chart
The statistical analysis conducted on geographies consisting of 190,488,118 people shows a mild positive correlation between the proportion of Ghanaians and percentage of households with 3 or more vehicles available in the United States with a correlation coefficient (R) of 0.320 and weighted average of 16.4%. Similarly, the statistical analysis conducted on geographies consisting of 123,487,614 people shows a weak positive correlation between the proportion of Estonians and percentage of households with 3 or more vehicles available in the United States with a correlation coefficient (R) of 0.290 and weighted average of 19.7%, a difference of 20.4%.
3 or more Vehicles in Household Correlation Summary
| Measurement | Ghanaian | Estonian |
| Minimum | 1.4% | 2.6% |
| Maximum | 48.5% | 61.0% |
| Range | 47.1% | 58.5% |
| Mean | 20.5% | 24.1% |
| Median | 18.7% | 23.0% |
| Interquartile 25% (IQ1) | 15.3% | 19.4% |
| Interquartile 75% (IQ3) | 24.7% | 29.8% |
| Interquartile Range (IQR) | 9.4% | 10.3% |
| Standard Deviation (Sample) | 9.7% | 9.7% |
| Standard Deviation (Population) | 9.7% | 9.6% |
Similar Demographics by 3 or more Vehicles in Household
Demographics Similar to Ghanaians by 3 or more Vehicles in Household
In terms of 3 or more vehicles in household, the demographic groups most similar to Ghanaians are Immigrants from Morocco (16.3%, a difference of 0.26%), Immigrants from Serbia (16.4%, a difference of 0.47%), Immigrants from Greece (16.5%, a difference of 0.78%), Somali (16.2%, a difference of 1.1%), and Paraguayan (16.6%, a difference of 1.2%).
| Demographics | Rating | Rank | 3 or more Vehicles in Household |
| Israelis | 0.1 /100 | #297 | Tragic 16.8% |
| Immigrants | Zaire | 0.1 /100 | #298 | Tragic 16.7% |
| Immigrants | South America | 0.1 /100 | #299 | Tragic 16.7% |
| Cypriots | 0.0 /100 | #300 | Tragic 16.6% |
| Paraguayans | 0.0 /100 | #301 | Tragic 16.6% |
| Immigrants | Greece | 0.0 /100 | #302 | Tragic 16.5% |
| Immigrants | Serbia | 0.0 /100 | #303 | Tragic 16.4% |
| Ghanaians | 0.0 /100 | #304 | Tragic 16.4% |
| Immigrants | Morocco | 0.0 /100 | #305 | Tragic 16.3% |
| Somalis | 0.0 /100 | #306 | Tragic 16.2% |
| Immigrants | Ghana | 0.0 /100 | #307 | Tragic 16.2% |
| Houma | 0.0 /100 | #308 | Tragic 16.1% |
| Immigrants | Somalia | 0.0 /100 | #309 | Tragic 15.9% |
| Moroccans | 0.0 /100 | #310 | Tragic 15.9% |
| Albanians | 0.0 /100 | #311 | Tragic 15.8% |
Demographics Similar to Estonians by 3 or more Vehicles in Household
In terms of 3 or more vehicles in household, the demographic groups most similar to Estonians are Chilean (19.7%, a difference of 0.020%), Yugoslavian (19.7%, a difference of 0.030%), Immigrants from Costa Rica (19.7%, a difference of 0.11%), Immigrants from Guatemala (19.7%, a difference of 0.19%), and Immigrants from Cameroon (19.7%, a difference of 0.19%).
| Demographics | Rating | Rank | 3 or more Vehicles in Household |
| Tlingit-Haida | 73.4 /100 | #155 | Good 19.9% |
| Thais | 71.1 /100 | #156 | Good 19.8% |
| Hungarians | 70.5 /100 | #157 | Good 19.8% |
| Armenians | 68.8 /100 | #158 | Good 19.8% |
| Immigrants | Pakistan | 68.2 /100 | #159 | Good 19.8% |
| Immigrants | Lebanon | 67.6 /100 | #160 | Good 19.8% |
| Immigrants | Guatemala | 65.6 /100 | #161 | Good 19.7% |
| Estonians | 63.2 /100 | #162 | Good 19.7% |
| Chileans | 63.0 /100 | #163 | Good 19.7% |
| Yugoslavians | 62.9 /100 | #164 | Good 19.7% |
| Immigrants | Costa Rica | 61.9 /100 | #165 | Good 19.7% |
| Immigrants | Cameroon | 60.9 /100 | #166 | Good 19.7% |
| Ukrainians | 58.9 /100 | #167 | Average 19.6% |
| Peruvians | 58.8 /100 | #168 | Average 19.6% |
| Immigrants | Denmark | 57.6 /100 | #169 | Average 19.6% |