Sierra Leonean vs Immigrants from Albania 3 or more Vehicles in Household
COMPARE
Sierra Leonean
Immigrants from Albania
3 or more Vehicles in Household
3 or more Vehicles in Household Comparison
Sierra Leoneans
Immigrants from Albania
18.3%
3 OR MORE VEHICLES IN HOUSEHOLD
3.9/ 100
METRIC RATING
235th/ 347
METRIC RANK
14.0%
3 OR MORE VEHICLES IN HOUSEHOLD
0.0/ 100
METRIC RATING
328th/ 347
METRIC RANK
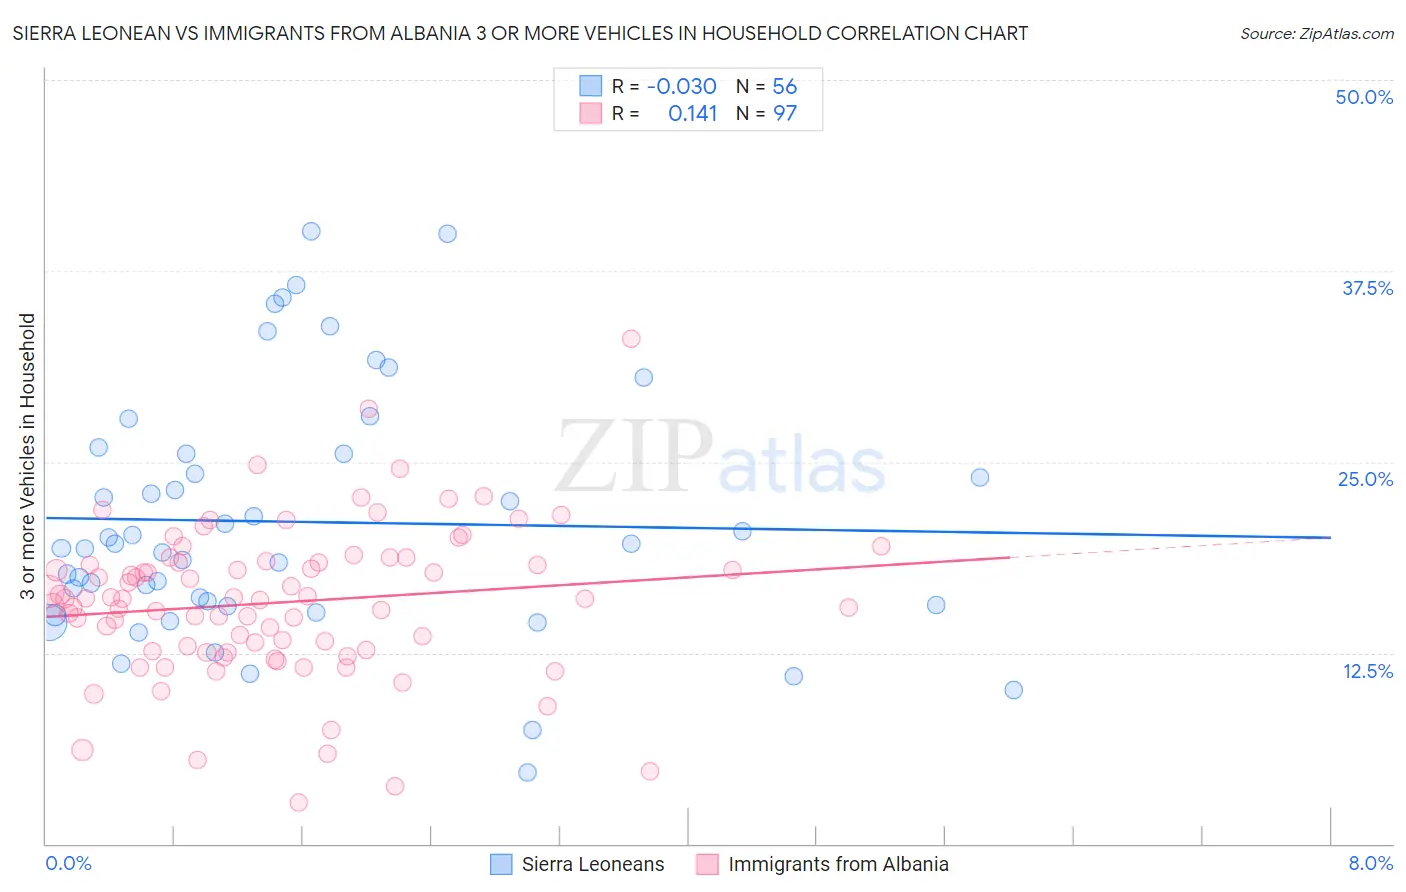
Sierra Leonean vs Immigrants from Albania 3 or more Vehicles in Household Correlation Chart
The statistical analysis conducted on geographies consisting of 83,340,667 people shows no correlation between the proportion of Sierra Leoneans and percentage of households with 3 or more vehicles available in the United States with a correlation coefficient (R) of -0.030 and weighted average of 18.3%. Similarly, the statistical analysis conducted on geographies consisting of 119,328,731 people shows a poor positive correlation between the proportion of Immigrants from Albania and percentage of households with 3 or more vehicles available in the United States with a correlation coefficient (R) of 0.141 and weighted average of 14.0%, a difference of 31.3%.
3 or more Vehicles in Household Correlation Summary
| Measurement | Sierra Leonean | Immigrants from Albania |
| Minimum | 4.7% | 2.7% |
| Maximum | 40.1% | 33.0% |
| Range | 35.5% | 30.3% |
| Mean | 21.1% | 15.8% |
| Median | 19.5% | 16.1% |
| Interquartile 25% (IQ1) | 15.6% | 12.6% |
| Interquartile 75% (IQ3) | 25.5% | 18.4% |
| Interquartile Range (IQR) | 10.0% | 5.8% |
| Standard Deviation (Sample) | 8.1% | 5.0% |
| Standard Deviation (Population) | 8.0% | 5.0% |
Similar Demographics by 3 or more Vehicles in Household
Demographics Similar to Sierra Leoneans by 3 or more Vehicles in Household
In terms of 3 or more vehicles in household, the demographic groups most similar to Sierra Leoneans are Immigrants from Malaysia (18.3%, a difference of 0.18%), Indonesian (18.3%, a difference of 0.23%), Immigrants from North Macedonia (18.4%, a difference of 0.28%), Honduran (18.4%, a difference of 0.34%), and Immigrants from Uganda (18.4%, a difference of 0.36%).
| Demographics | Rating | Rank | 3 or more Vehicles in Household |
| Turks | 5.4 /100 | #228 | Tragic 18.4% |
| Immigrants | Switzerland | 5.0 /100 | #229 | Tragic 18.4% |
| Immigrants | Western Asia | 4.8 /100 | #230 | Tragic 18.4% |
| Immigrants | Belgium | 4.8 /100 | #231 | Tragic 18.4% |
| Immigrants | Uganda | 4.6 /100 | #232 | Tragic 18.4% |
| Hondurans | 4.6 /100 | #233 | Tragic 18.4% |
| Immigrants | North Macedonia | 4.4 /100 | #234 | Tragic 18.4% |
| Sierra Leoneans | 3.9 /100 | #235 | Tragic 18.3% |
| Immigrants | Malaysia | 3.6 /100 | #236 | Tragic 18.3% |
| Indonesians | 3.5 /100 | #237 | Tragic 18.3% |
| Immigrants | Honduras | 3.1 /100 | #238 | Tragic 18.2% |
| Immigrants | Middle Africa | 3.1 /100 | #239 | Tragic 18.2% |
| Immigrants | China | 2.9 /100 | #240 | Tragic 18.2% |
| Africans | 2.7 /100 | #241 | Tragic 18.2% |
| Hopi | 2.5 /100 | #242 | Tragic 18.2% |
Demographics Similar to Immigrants from Albania by 3 or more Vehicles in Household
In terms of 3 or more vehicles in household, the demographic groups most similar to Immigrants from Albania are Ecuadorian (14.1%, a difference of 0.71%), Immigrants from Senegal (13.8%, a difference of 1.2%), West Indian (13.7%, a difference of 1.5%), Soviet Union (14.2%, a difference of 1.6%), and Immigrants from Dominica (13.7%, a difference of 1.7%).
| Demographics | Rating | Rank | 3 or more Vehicles in Household |
| Immigrants | Jamaica | 0.0 /100 | #321 | Tragic 14.7% |
| Immigrants | West Indies | 0.0 /100 | #322 | Tragic 14.6% |
| Immigrants | Caribbean | 0.0 /100 | #323 | Tragic 14.6% |
| Immigrants | Yemen | 0.0 /100 | #324 | Tragic 14.2% |
| Senegalese | 0.0 /100 | #325 | Tragic 14.2% |
| Soviet Union | 0.0 /100 | #326 | Tragic 14.2% |
| Ecuadorians | 0.0 /100 | #327 | Tragic 14.1% |
| Immigrants | Albania | 0.0 /100 | #328 | Tragic 14.0% |
| Immigrants | Senegal | 0.0 /100 | #329 | Tragic 13.8% |
| West Indians | 0.0 /100 | #330 | Tragic 13.7% |
| Immigrants | Dominica | 0.0 /100 | #331 | Tragic 13.7% |
| Trinidadians and Tobagonians | 0.0 /100 | #332 | Tragic 13.6% |
| Immigrants | Cabo Verde | 0.0 /100 | #333 | Tragic 13.6% |
| Immigrants | Ecuador | 0.0 /100 | #334 | Tragic 13.4% |
| Immigrants | Trinidad and Tobago | 0.0 /100 | #335 | Tragic 13.3% |