Guatemalan vs Estonian 3 or more Vehicles in Household
COMPARE
Guatemalan
Estonian
3 or more Vehicles in Household
3 or more Vehicles in Household Comparison
Guatemalans
Estonians
20.1%
3 OR MORE VEHICLES IN HOUSEHOLD
82.6/ 100
METRIC RATING
148th/ 347
METRIC RANK
19.7%
3 OR MORE VEHICLES IN HOUSEHOLD
63.2/ 100
METRIC RATING
162nd/ 347
METRIC RANK
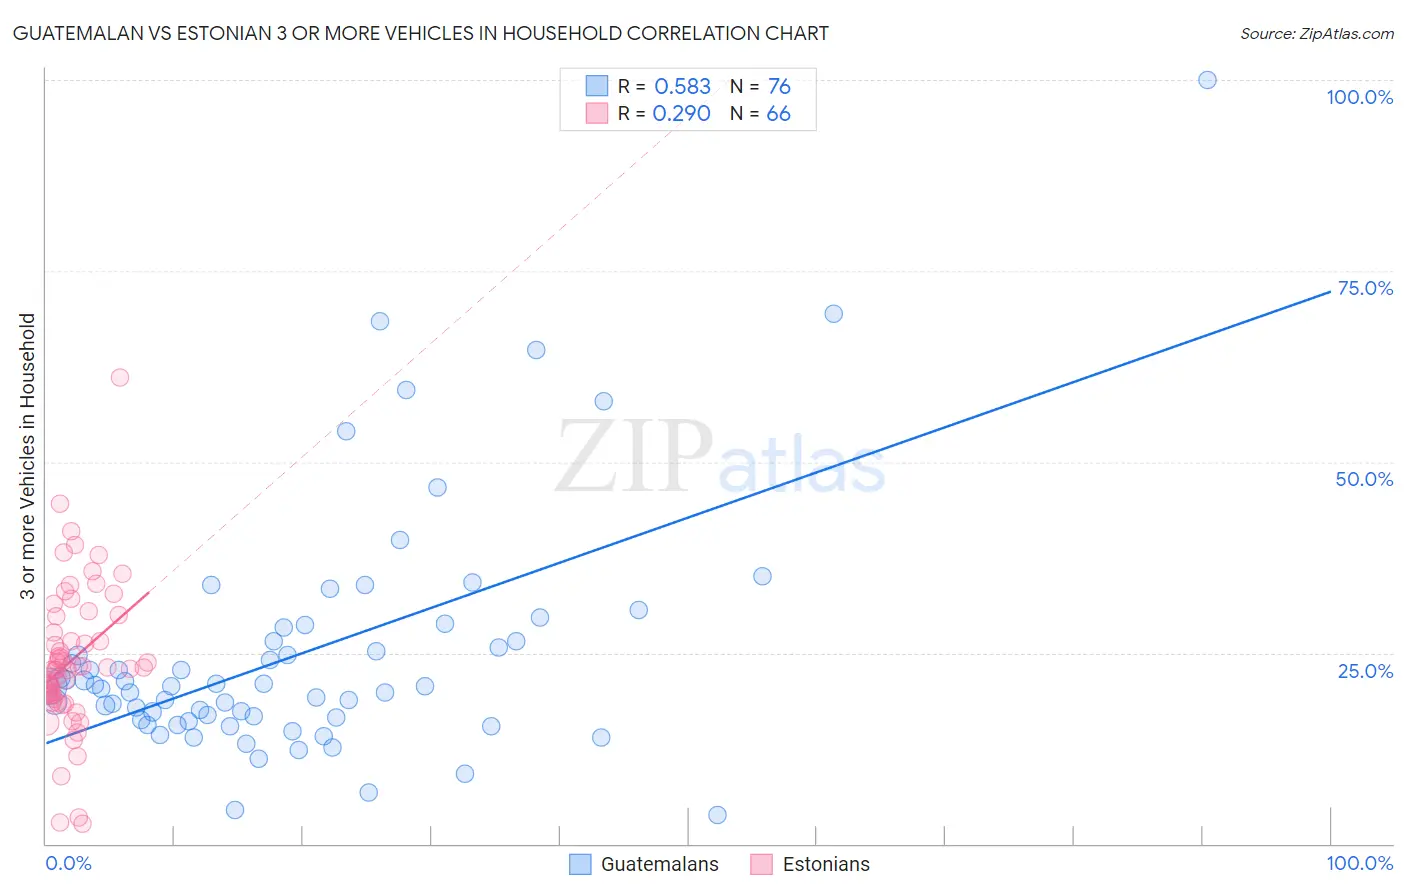
Guatemalan vs Estonian 3 or more Vehicles in Household Correlation Chart
The statistical analysis conducted on geographies consisting of 409,244,641 people shows a substantial positive correlation between the proportion of Guatemalans and percentage of households with 3 or more vehicles available in the United States with a correlation coefficient (R) of 0.583 and weighted average of 20.1%. Similarly, the statistical analysis conducted on geographies consisting of 123,487,614 people shows a weak positive correlation between the proportion of Estonians and percentage of households with 3 or more vehicles available in the United States with a correlation coefficient (R) of 0.290 and weighted average of 19.7%, a difference of 1.9%.
3 or more Vehicles in Household Correlation Summary
| Measurement | Guatemalan | Estonian |
| Minimum | 3.8% | 2.6% |
| Maximum | 100.0% | 61.0% |
| Range | 96.2% | 58.5% |
| Mean | 25.1% | 24.1% |
| Median | 20.6% | 23.0% |
| Interquartile 25% (IQ1) | 16.3% | 19.4% |
| Interquartile 75% (IQ3) | 27.4% | 29.8% |
| Interquartile Range (IQR) | 11.1% | 10.3% |
| Standard Deviation (Sample) | 16.1% | 9.7% |
| Standard Deviation (Population) | 16.0% | 9.6% |
Demographics Similar to Guatemalans and Estonians by 3 or more Vehicles in Household
In terms of 3 or more vehicles in household, the demographic groups most similar to Guatemalans are Slovak (20.1%, a difference of 0.060%), Australian (20.1%, a difference of 0.14%), Palestinian (20.1%, a difference of 0.18%), Immigrants from Iran (20.0%, a difference of 0.20%), and Immigrants (20.0%, a difference of 0.22%). Similarly, the demographic groups most similar to Estonians are Chilean (19.7%, a difference of 0.020%), Yugoslavian (19.7%, a difference of 0.030%), Immigrants from Costa Rica (19.7%, a difference of 0.11%), Immigrants from Guatemala (19.7%, a difference of 0.19%), and Immigrants from Lebanon (19.8%, a difference of 0.36%).
| Demographics | Rating | Rank | 3 or more Vehicles in Household |
| Palestinians | 83.9 /100 | #145 | Excellent 20.1% |
| Australians | 83.6 /100 | #146 | Excellent 20.1% |
| Slovaks | 83.0 /100 | #147 | Excellent 20.1% |
| Guatemalans | 82.6 /100 | #148 | Excellent 20.1% |
| Immigrants | Iran | 80.9 /100 | #149 | Excellent 20.0% |
| Immigrants | Immigrants | 80.8 /100 | #150 | Excellent 20.0% |
| Taiwanese | 80.6 /100 | #151 | Excellent 20.0% |
| Lebanese | 79.8 /100 | #152 | Good 20.0% |
| Yuman | 75.6 /100 | #153 | Good 19.9% |
| Immigrants | Jordan | 75.0 /100 | #154 | Good 19.9% |
| Tlingit-Haida | 73.4 /100 | #155 | Good 19.9% |
| Thais | 71.1 /100 | #156 | Good 19.8% |
| Hungarians | 70.5 /100 | #157 | Good 19.8% |
| Armenians | 68.8 /100 | #158 | Good 19.8% |
| Immigrants | Pakistan | 68.2 /100 | #159 | Good 19.8% |
| Immigrants | Lebanon | 67.6 /100 | #160 | Good 19.8% |
| Immigrants | Guatemala | 65.6 /100 | #161 | Good 19.7% |
| Estonians | 63.2 /100 | #162 | Good 19.7% |
| Chileans | 63.0 /100 | #163 | Good 19.7% |
| Yugoslavians | 62.9 /100 | #164 | Good 19.7% |
| Immigrants | Costa Rica | 61.9 /100 | #165 | Good 19.7% |