Seminole vs Immigrants from North Macedonia 3 or more Vehicles in Household
COMPARE
Seminole
Immigrants from North Macedonia
3 or more Vehicles in Household
3 or more Vehicles in Household Comparison
Seminole
Immigrants from North Macedonia
20.9%
3 OR MORE VEHICLES IN HOUSEHOLD
97.8/ 100
METRIC RATING
102nd/ 347
METRIC RANK
18.4%
3 OR MORE VEHICLES IN HOUSEHOLD
4.4/ 100
METRIC RATING
234th/ 347
METRIC RANK
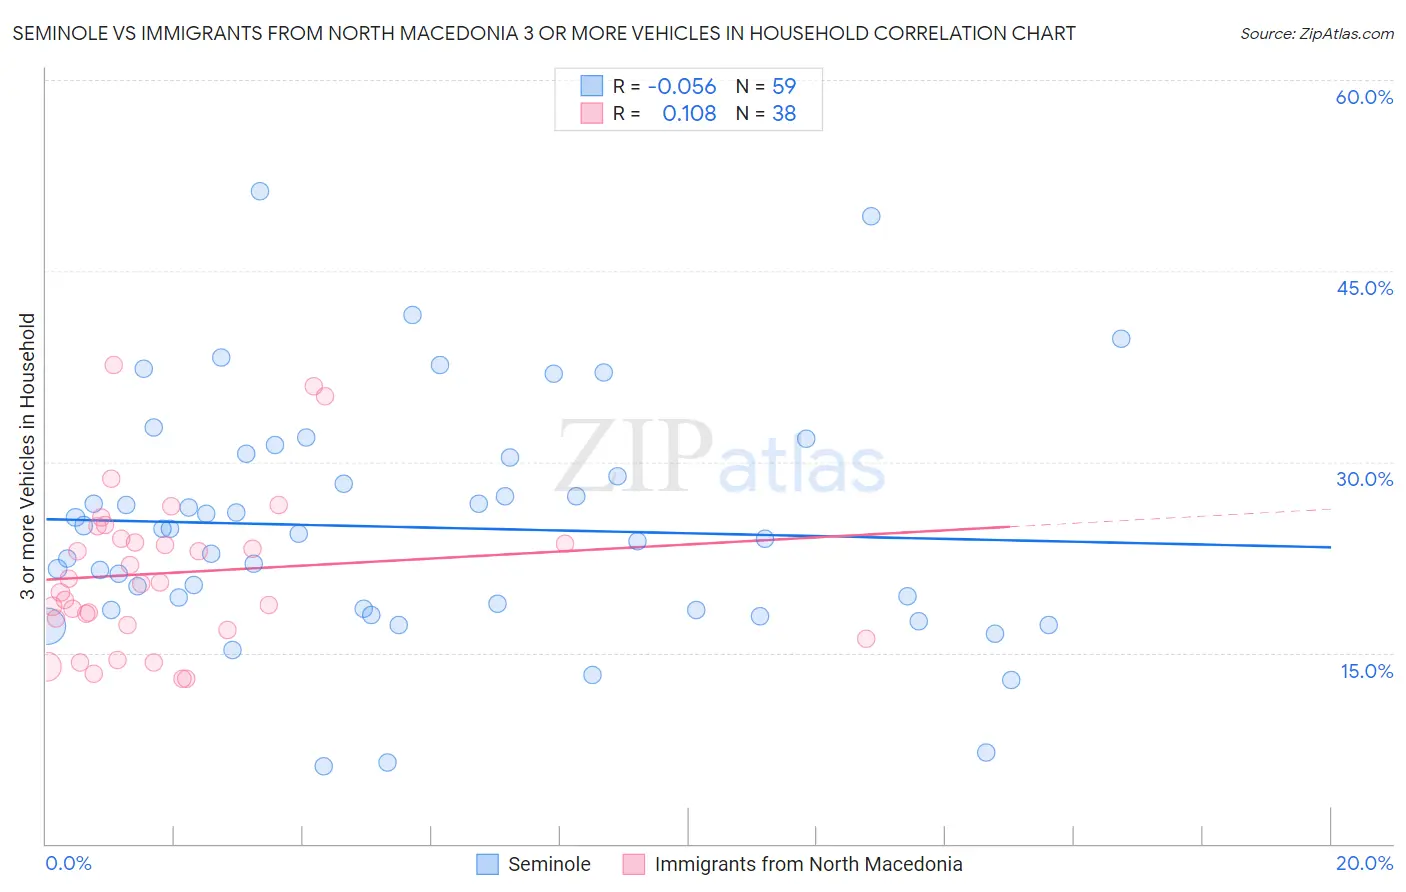
Seminole vs Immigrants from North Macedonia 3 or more Vehicles in Household Correlation Chart
The statistical analysis conducted on geographies consisting of 118,297,727 people shows a slight negative correlation between the proportion of Seminole and percentage of households with 3 or more vehicles available in the United States with a correlation coefficient (R) of -0.056 and weighted average of 20.9%. Similarly, the statistical analysis conducted on geographies consisting of 74,290,299 people shows a poor positive correlation between the proportion of Immigrants from North Macedonia and percentage of households with 3 or more vehicles available in the United States with a correlation coefficient (R) of 0.108 and weighted average of 18.4%, a difference of 13.8%.
3 or more Vehicles in Household Correlation Summary
| Measurement | Seminole | Immigrants from North Macedonia |
| Minimum | 6.1% | 12.9% |
| Maximum | 51.2% | 37.6% |
| Range | 45.1% | 24.7% |
| Mean | 24.9% | 21.3% |
| Median | 24.4% | 20.5% |
| Interquartile 25% (IQ1) | 18.4% | 17.2% |
| Interquartile 75% (IQ3) | 30.3% | 24.0% |
| Interquartile Range (IQR) | 11.9% | 6.8% |
| Standard Deviation (Sample) | 9.3% | 6.1% |
| Standard Deviation (Population) | 9.2% | 6.1% |
Similar Demographics by 3 or more Vehicles in Household
Demographics Similar to Seminole by 3 or more Vehicles in Household
In terms of 3 or more vehicles in household, the demographic groups most similar to Seminole are Blackfeet (20.9%, a difference of 0.030%), Dutch West Indian (20.9%, a difference of 0.040%), Luxembourger (20.9%, a difference of 0.12%), Austrian (20.9%, a difference of 0.23%), and Bolivian (20.8%, a difference of 0.32%).
| Demographics | Rating | Rank | 3 or more Vehicles in Household |
| Pakistanis | 98.5 /100 | #95 | Exceptional 21.0% |
| Cree | 98.4 /100 | #96 | Exceptional 21.0% |
| Canadians | 98.3 /100 | #97 | Exceptional 21.0% |
| Hmong | 98.2 /100 | #98 | Exceptional 21.0% |
| Alaska Natives | 98.2 /100 | #99 | Exceptional 21.0% |
| Comanche | 98.2 /100 | #100 | Exceptional 21.0% |
| Blackfeet | 97.9 /100 | #101 | Exceptional 20.9% |
| Seminole | 97.8 /100 | #102 | Exceptional 20.9% |
| Dutch West Indians | 97.8 /100 | #103 | Exceptional 20.9% |
| Luxembourgers | 97.7 /100 | #104 | Exceptional 20.9% |
| Austrians | 97.5 /100 | #105 | Exceptional 20.9% |
| Bolivians | 97.4 /100 | #106 | Exceptional 20.8% |
| Immigrants | Germany | 97.4 /100 | #107 | Exceptional 20.8% |
| Immigrants | Scotland | 97.1 /100 | #108 | Exceptional 20.8% |
| Filipinos | 97.0 /100 | #109 | Exceptional 20.8% |
Demographics Similar to Immigrants from North Macedonia by 3 or more Vehicles in Household
In terms of 3 or more vehicles in household, the demographic groups most similar to Immigrants from North Macedonia are Honduran (18.4%, a difference of 0.070%), Immigrants from Uganda (18.4%, a difference of 0.080%), Immigrants from Belgium (18.4%, a difference of 0.15%), Immigrants from Western Asia (18.4%, a difference of 0.17%), and Immigrants from Switzerland (18.4%, a difference of 0.23%).
| Demographics | Rating | Rank | 3 or more Vehicles in Household |
| Immigrants | Singapore | 5.4 /100 | #227 | Tragic 18.4% |
| Turks | 5.4 /100 | #228 | Tragic 18.4% |
| Immigrants | Switzerland | 5.0 /100 | #229 | Tragic 18.4% |
| Immigrants | Western Asia | 4.8 /100 | #230 | Tragic 18.4% |
| Immigrants | Belgium | 4.8 /100 | #231 | Tragic 18.4% |
| Immigrants | Uganda | 4.6 /100 | #232 | Tragic 18.4% |
| Hondurans | 4.6 /100 | #233 | Tragic 18.4% |
| Immigrants | North Macedonia | 4.4 /100 | #234 | Tragic 18.4% |
| Sierra Leoneans | 3.9 /100 | #235 | Tragic 18.3% |
| Immigrants | Malaysia | 3.6 /100 | #236 | Tragic 18.3% |
| Indonesians | 3.5 /100 | #237 | Tragic 18.3% |
| Immigrants | Honduras | 3.1 /100 | #238 | Tragic 18.2% |
| Immigrants | Middle Africa | 3.1 /100 | #239 | Tragic 18.2% |
| Immigrants | China | 2.9 /100 | #240 | Tragic 18.2% |
| Africans | 2.7 /100 | #241 | Tragic 18.2% |