Seminole vs Immigrants from North Macedonia Median Household Income
COMPARE
Seminole
Immigrants from North Macedonia
Median Household Income
Median Household Income Comparison
Seminole
Immigrants from North Macedonia
$69,420
MEDIAN HOUSEHOLD INCOME
0.0/ 100
METRIC RATING
325th/ 347
METRIC RANK
$89,741
MEDIAN HOUSEHOLD INCOME
95.2/ 100
METRIC RATING
120th/ 347
METRIC RANK
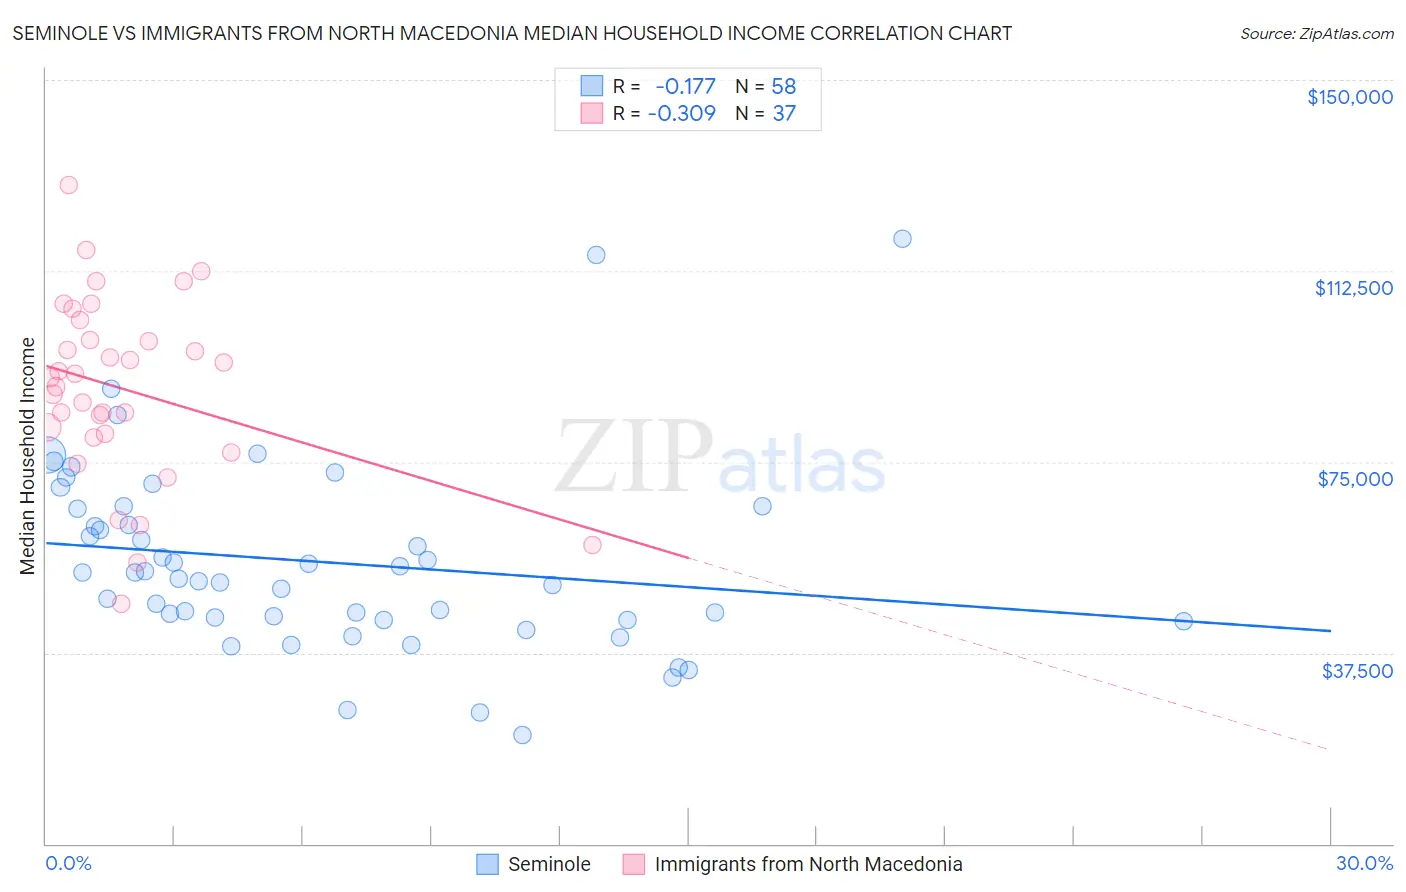
Seminole vs Immigrants from North Macedonia Median Household Income Correlation Chart
The statistical analysis conducted on geographies consisting of 118,297,671 people shows a poor negative correlation between the proportion of Seminole and median household income in the United States with a correlation coefficient (R) of -0.177 and weighted average of $69,420. Similarly, the statistical analysis conducted on geographies consisting of 74,304,962 people shows a mild negative correlation between the proportion of Immigrants from North Macedonia and median household income in the United States with a correlation coefficient (R) of -0.309 and weighted average of $89,741, a difference of 29.3%.
Median Household Income Correlation Summary
| Measurement | Seminole | Immigrants from North Macedonia |
| Minimum | $21,429 | $47,094 |
| Maximum | $118,750 | $129,437 |
| Range | $97,321 | $82,343 |
| Mean | $55,357 | $89,408 |
| Median | $52,689 | $91,504 |
| Interquartile 25% (IQ1) | $44,050 | $80,151 |
| Interquartile 75% (IQ3) | $65,850 | $100,949 |
| Interquartile Range (IQR) | $21,800 | $20,798 |
| Standard Deviation (Sample) | $18,667 | $17,826 |
| Standard Deviation (Population) | $18,505 | $17,584 |
Similar Demographics by Median Household Income
Demographics Similar to Seminole by Median Household Income
In terms of median household income, the demographic groups most similar to Seminole are Yup'ik ($69,695, a difference of 0.40%), Bahamian ($69,726, a difference of 0.44%), Choctaw ($69,947, a difference of 0.76%), Chickasaw ($70,005, a difference of 0.84%), and Colville ($70,094, a difference of 0.97%).
| Demographics | Rating | Rank | Median Household Income |
| Chippewa | 0.0 /100 | #318 | Tragic $70,539 |
| Immigrants | Dominican Republic | 0.0 /100 | #319 | Tragic $70,208 |
| Colville | 0.0 /100 | #320 | Tragic $70,094 |
| Chickasaw | 0.0 /100 | #321 | Tragic $70,005 |
| Choctaw | 0.0 /100 | #322 | Tragic $69,947 |
| Bahamians | 0.0 /100 | #323 | Tragic $69,726 |
| Yup'ik | 0.0 /100 | #324 | Tragic $69,695 |
| Seminole | 0.0 /100 | #325 | Tragic $69,420 |
| Yuman | 0.0 /100 | #326 | Tragic $68,743 |
| Immigrants | Cuba | 0.0 /100 | #327 | Tragic $68,461 |
| Menominee | 0.0 /100 | #328 | Tragic $68,423 |
| Dutch West Indians | 0.0 /100 | #329 | Tragic $68,412 |
| Arapaho | 0.0 /100 | #330 | Tragic $67,965 |
| Natives/Alaskans | 0.0 /100 | #331 | Tragic $67,879 |
| Sioux | 0.0 /100 | #332 | Tragic $67,792 |
Demographics Similar to Immigrants from North Macedonia by Median Household Income
In terms of median household income, the demographic groups most similar to Immigrants from North Macedonia are Albanian ($89,744, a difference of 0.0%), Syrian ($89,830, a difference of 0.10%), Ethiopian ($89,640, a difference of 0.11%), Pakistani ($89,638, a difference of 0.11%), and Taiwanese ($89,900, a difference of 0.18%).
| Demographics | Rating | Rank | Median Household Income |
| Peruvians | 96.5 /100 | #113 | Exceptional $90,261 |
| Immigrants | Northern Africa | 95.9 /100 | #114 | Exceptional $90,026 |
| Immigrants | Western Asia | 95.9 /100 | #115 | Exceptional $90,005 |
| Native Hawaiians | 95.7 /100 | #116 | Exceptional $89,919 |
| Taiwanese | 95.6 /100 | #117 | Exceptional $89,900 |
| Syrians | 95.4 /100 | #118 | Exceptional $89,830 |
| Albanians | 95.2 /100 | #119 | Exceptional $89,744 |
| Immigrants | North Macedonia | 95.2 /100 | #120 | Exceptional $89,741 |
| Ethiopians | 94.9 /100 | #121 | Exceptional $89,640 |
| Pakistanis | 94.8 /100 | #122 | Exceptional $89,638 |
| Immigrants | Zimbabwe | 94.4 /100 | #123 | Exceptional $89,496 |
| Immigrants | Jordan | 94.1 /100 | #124 | Exceptional $89,412 |
| Immigrants | Kuwait | 93.5 /100 | #125 | Exceptional $89,263 |
| Immigrants | Oceania | 92.9 /100 | #126 | Exceptional $89,100 |
| Immigrants | Peru | 92.5 /100 | #127 | Exceptional $89,010 |