Seminole vs Immigrants from North Macedonia Divorced or Separated
COMPARE
Seminole
Immigrants from North Macedonia
Divorced or Separated
Divorced or Separated Comparison
Seminole
Immigrants from North Macedonia
14.3%
DIVORCED OR SEPARATED
0.0/ 100
METRIC RATING
342nd/ 347
METRIC RANK
11.5%
DIVORCED OR SEPARATED
99.6/ 100
METRIC RATING
73rd/ 347
METRIC RANK
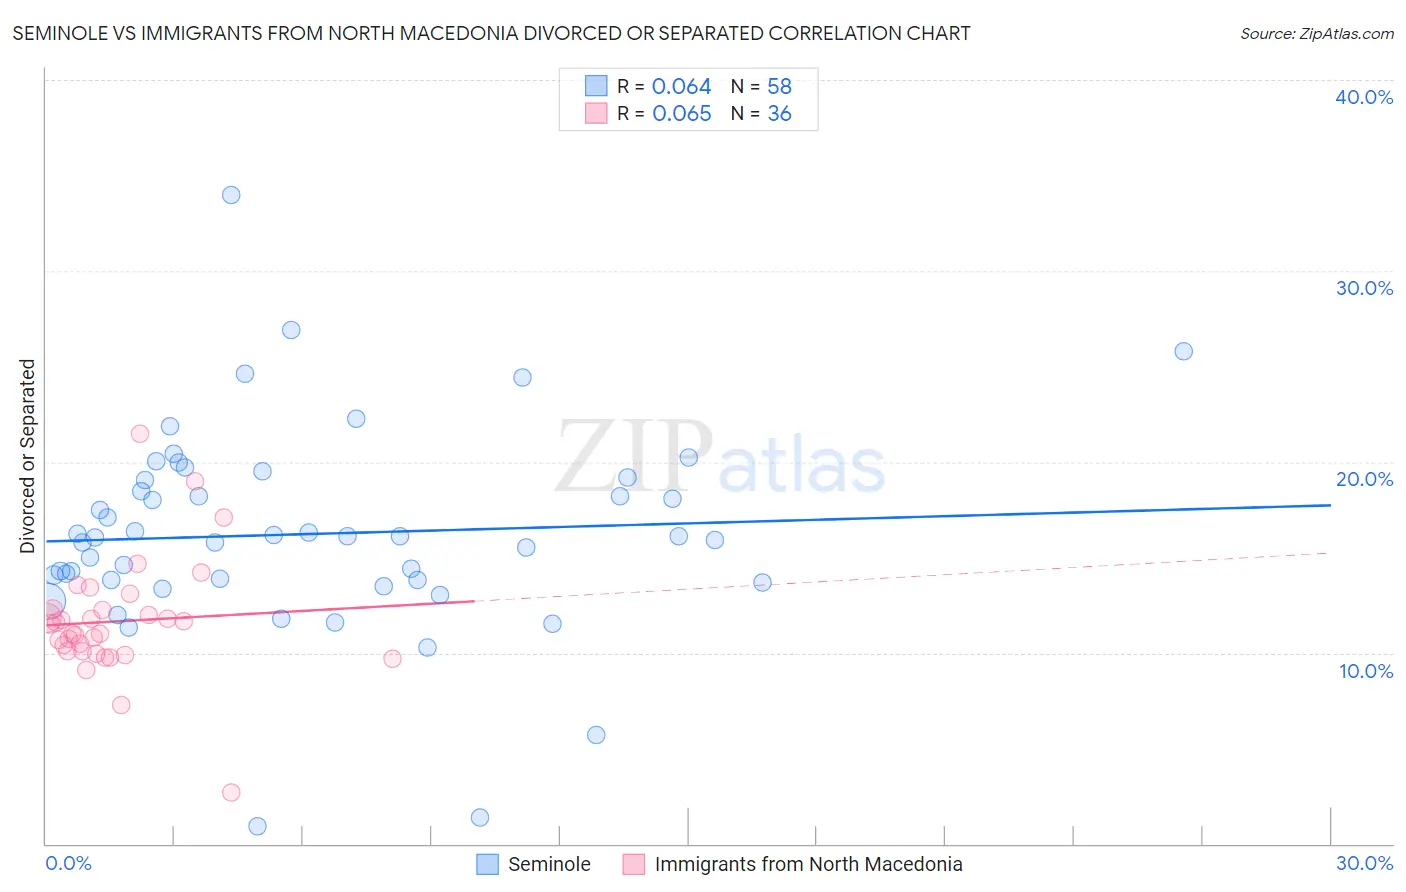
Seminole vs Immigrants from North Macedonia Divorced or Separated Correlation Chart
The statistical analysis conducted on geographies consisting of 118,302,792 people shows a slight positive correlation between the proportion of Seminole and percentage of population currently divorced or separated in the United States with a correlation coefficient (R) of 0.064 and weighted average of 14.3%. Similarly, the statistical analysis conducted on geographies consisting of 74,304,783 people shows a slight positive correlation between the proportion of Immigrants from North Macedonia and percentage of population currently divorced or separated in the United States with a correlation coefficient (R) of 0.065 and weighted average of 11.5%, a difference of 24.3%.
Divorced or Separated Correlation Summary
| Measurement | Seminole | Immigrants from North Macedonia |
| Minimum | 0.90% | 2.7% |
| Maximum | 34.0% | 21.4% |
| Range | 33.1% | 18.7% |
| Mean | 16.2% | 11.6% |
| Median | 16.1% | 11.3% |
| Interquartile 25% (IQ1) | 13.8% | 10.1% |
| Interquartile 75% (IQ3) | 19.0% | 12.3% |
| Interquartile Range (IQR) | 5.2% | 2.2% |
| Standard Deviation (Sample) | 5.4% | 3.1% |
| Standard Deviation (Population) | 5.3% | 3.1% |
Similar Demographics by Divorced or Separated
Demographics Similar to Seminole by Divorced or Separated
In terms of divorced or separated, the demographic groups most similar to Seminole are Bahamian (14.2%, a difference of 0.17%), Chickasaw (14.2%, a difference of 0.36%), Colville (14.2%, a difference of 0.40%), Choctaw (14.1%, a difference of 0.93%), and Creek (14.4%, a difference of 1.1%).
| Demographics | Rating | Rank | Divorced or Separated |
| Puerto Ricans | 0.0 /100 | #333 | Tragic 13.9% |
| Immigrants | Bahamas | 0.0 /100 | #334 | Tragic 13.9% |
| Dutch West Indians | 0.0 /100 | #335 | Tragic 14.0% |
| Shoshone | 0.0 /100 | #336 | Tragic 14.0% |
| Crow | 0.0 /100 | #337 | Tragic 14.1% |
| Choctaw | 0.0 /100 | #338 | Tragic 14.1% |
| Colville | 0.0 /100 | #339 | Tragic 14.2% |
| Chickasaw | 0.0 /100 | #340 | Tragic 14.2% |
| Bahamians | 0.0 /100 | #341 | Tragic 14.2% |
| Seminole | 0.0 /100 | #342 | Tragic 14.3% |
| Creek | 0.0 /100 | #343 | Tragic 14.4% |
| Cubans | 0.0 /100 | #344 | Tragic 14.5% |
| Kiowa | 0.0 /100 | #345 | Tragic 14.5% |
| Arapaho | 0.0 /100 | #346 | Tragic 14.8% |
| Immigrants | Cuba | 0.0 /100 | #347 | Tragic 15.2% |
Demographics Similar to Immigrants from North Macedonia by Divorced or Separated
In terms of divorced or separated, the demographic groups most similar to Immigrants from North Macedonia are Jordanian (11.5%, a difference of 0.0%), Paraguayan (11.5%, a difference of 0.060%), Taiwanese (11.5%, a difference of 0.060%), Immigrants from Northern Africa (11.5%, a difference of 0.14%), and Immigrants from Eastern Europe (11.5%, a difference of 0.16%).
| Demographics | Rating | Rank | Divorced or Separated |
| Inupiat | 99.8 /100 | #66 | Exceptional 11.4% |
| Immigrants | Syria | 99.7 /100 | #67 | Exceptional 11.4% |
| Palestinians | 99.7 /100 | #68 | Exceptional 11.5% |
| Immigrants | Belgium | 99.7 /100 | #69 | Exceptional 11.5% |
| Immigrants | Eastern Europe | 99.7 /100 | #70 | Exceptional 11.5% |
| Paraguayans | 99.7 /100 | #71 | Exceptional 11.5% |
| Jordanians | 99.6 /100 | #72 | Exceptional 11.5% |
| Immigrants | North Macedonia | 99.6 /100 | #73 | Exceptional 11.5% |
| Taiwanese | 99.6 /100 | #74 | Exceptional 11.5% |
| Immigrants | Northern Africa | 99.6 /100 | #75 | Exceptional 11.5% |
| Albanians | 99.6 /100 | #76 | Exceptional 11.5% |
| Immigrants | Italy | 99.5 /100 | #77 | Exceptional 11.5% |
| Afghans | 99.4 /100 | #78 | Exceptional 11.5% |
| Guyanese | 99.4 /100 | #79 | Exceptional 11.5% |
| Immigrants | Switzerland | 99.4 /100 | #80 | Exceptional 11.5% |