Seminole vs Immigrants from Asia 3 or more Vehicles in Household
COMPARE
Seminole
Immigrants from Asia
3 or more Vehicles in Household
3 or more Vehicles in Household Comparison
Seminole
Immigrants from Asia
20.9%
3 OR MORE VEHICLES IN HOUSEHOLD
97.8/ 100
METRIC RATING
102nd/ 347
METRIC RANK
20.2%
3 OR MORE VEHICLES IN HOUSEHOLD
88.1/ 100
METRIC RATING
131st/ 347
METRIC RANK
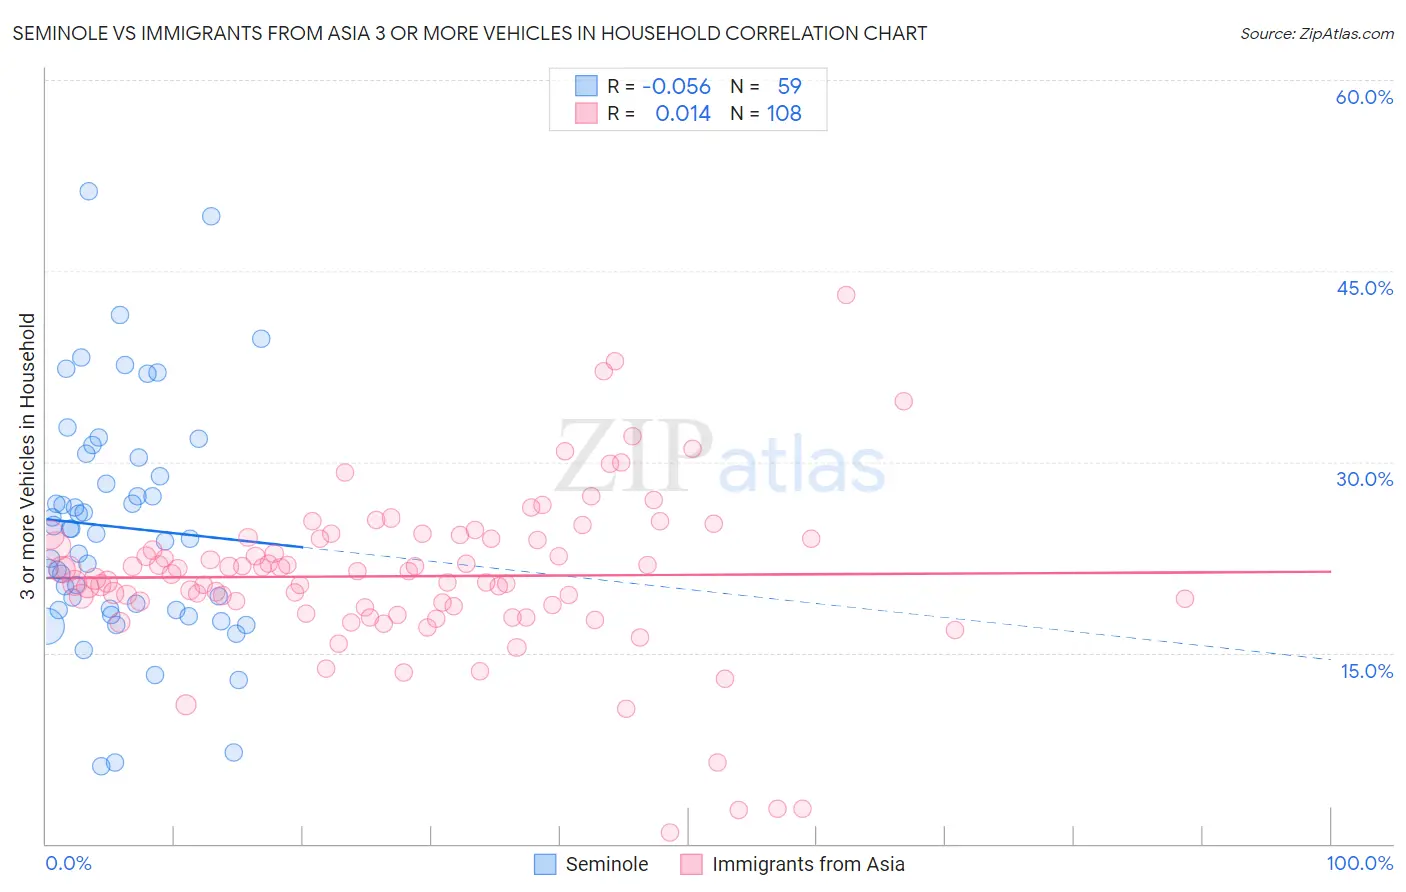
Seminole vs Immigrants from Asia 3 or more Vehicles in Household Correlation Chart
The statistical analysis conducted on geographies consisting of 118,297,727 people shows a slight negative correlation between the proportion of Seminole and percentage of households with 3 or more vehicles available in the United States with a correlation coefficient (R) of -0.056 and weighted average of 20.9%. Similarly, the statistical analysis conducted on geographies consisting of 548,260,501 people shows no correlation between the proportion of Immigrants from Asia and percentage of households with 3 or more vehicles available in the United States with a correlation coefficient (R) of 0.014 and weighted average of 20.2%, a difference of 3.3%.
3 or more Vehicles in Household Correlation Summary
| Measurement | Seminole | Immigrants from Asia |
| Minimum | 6.1% | 0.88% |
| Maximum | 51.2% | 43.1% |
| Range | 45.1% | 42.3% |
| Mean | 24.9% | 21.0% |
| Median | 24.4% | 21.3% |
| Interquartile 25% (IQ1) | 18.4% | 18.6% |
| Interquartile 75% (IQ3) | 30.3% | 24.0% |
| Interquartile Range (IQR) | 11.9% | 5.4% |
| Standard Deviation (Sample) | 9.3% | 6.5% |
| Standard Deviation (Population) | 9.2% | 6.4% |
Similar Demographics by 3 or more Vehicles in Household
Demographics Similar to Seminole by 3 or more Vehicles in Household
In terms of 3 or more vehicles in household, the demographic groups most similar to Seminole are Blackfeet (20.9%, a difference of 0.030%), Dutch West Indian (20.9%, a difference of 0.040%), Luxembourger (20.9%, a difference of 0.12%), Austrian (20.9%, a difference of 0.23%), and Bolivian (20.8%, a difference of 0.32%).
| Demographics | Rating | Rank | 3 or more Vehicles in Household |
| Pakistanis | 98.5 /100 | #95 | Exceptional 21.0% |
| Cree | 98.4 /100 | #96 | Exceptional 21.0% |
| Canadians | 98.3 /100 | #97 | Exceptional 21.0% |
| Hmong | 98.2 /100 | #98 | Exceptional 21.0% |
| Alaska Natives | 98.2 /100 | #99 | Exceptional 21.0% |
| Comanche | 98.2 /100 | #100 | Exceptional 21.0% |
| Blackfeet | 97.9 /100 | #101 | Exceptional 20.9% |
| Seminole | 97.8 /100 | #102 | Exceptional 20.9% |
| Dutch West Indians | 97.8 /100 | #103 | Exceptional 20.9% |
| Luxembourgers | 97.7 /100 | #104 | Exceptional 20.9% |
| Austrians | 97.5 /100 | #105 | Exceptional 20.9% |
| Bolivians | 97.4 /100 | #106 | Exceptional 20.8% |
| Immigrants | Germany | 97.4 /100 | #107 | Exceptional 20.8% |
| Immigrants | Scotland | 97.1 /100 | #108 | Exceptional 20.8% |
| Filipinos | 97.0 /100 | #109 | Exceptional 20.8% |
Demographics Similar to Immigrants from Asia by 3 or more Vehicles in Household
In terms of 3 or more vehicles in household, the demographic groups most similar to Immigrants from Asia are Immigrants from Canada (20.2%, a difference of 0.050%), Immigrants from North America (20.2%, a difference of 0.050%), Greek (20.3%, a difference of 0.070%), Zimbabwean (20.3%, a difference of 0.10%), and Polish (20.2%, a difference of 0.14%).
| Demographics | Rating | Rank | 3 or more Vehicles in Household |
| Central Americans | 93.1 /100 | #124 | Exceptional 20.5% |
| Immigrants | Netherlands | 92.9 /100 | #125 | Exceptional 20.4% |
| Slavs | 92.1 /100 | #126 | Exceptional 20.4% |
| Immigrants | Bolivia | 92.0 /100 | #127 | Exceptional 20.4% |
| New Zealanders | 91.3 /100 | #128 | Exceptional 20.4% |
| Zimbabweans | 88.7 /100 | #129 | Excellent 20.3% |
| Greeks | 88.6 /100 | #130 | Excellent 20.3% |
| Immigrants | Asia | 88.1 /100 | #131 | Excellent 20.2% |
| Immigrants | Canada | 87.8 /100 | #132 | Excellent 20.2% |
| Immigrants | North America | 87.8 /100 | #133 | Excellent 20.2% |
| Poles | 87.3 /100 | #134 | Excellent 20.2% |
| Immigrants | India | 87.2 /100 | #135 | Excellent 20.2% |
| Immigrants | Nicaragua | 87.1 /100 | #136 | Excellent 20.2% |
| Immigrants | Iraq | 87.1 /100 | #137 | Excellent 20.2% |
| Aleuts | 86.3 /100 | #138 | Excellent 20.2% |