Immigrants from Morocco vs Immigrants from North Macedonia 3 or more Vehicles in Household
COMPARE
Immigrants from Morocco
Immigrants from North Macedonia
3 or more Vehicles in Household
3 or more Vehicles in Household Comparison
Immigrants from Morocco
Immigrants from North Macedonia
16.3%
3 OR MORE VEHICLES IN HOUSEHOLD
0.0/ 100
METRIC RATING
305th/ 347
METRIC RANK
18.4%
3 OR MORE VEHICLES IN HOUSEHOLD
4.4/ 100
METRIC RATING
234th/ 347
METRIC RANK
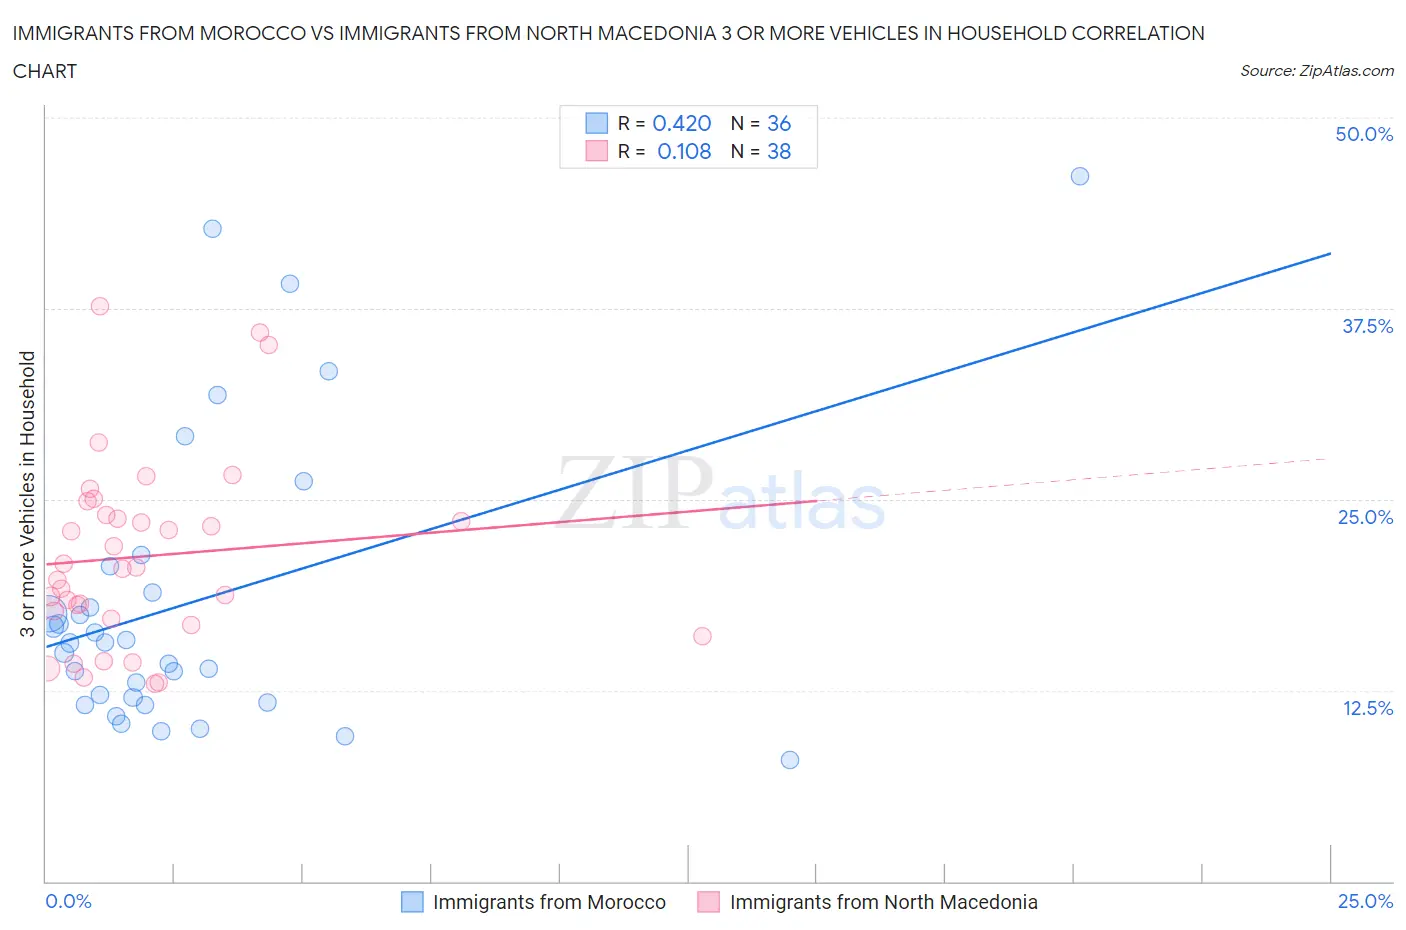
Immigrants from Morocco vs Immigrants from North Macedonia 3 or more Vehicles in Household Correlation Chart
The statistical analysis conducted on geographies consisting of 178,908,758 people shows a moderate positive correlation between the proportion of Immigrants from Morocco and percentage of households with 3 or more vehicles available in the United States with a correlation coefficient (R) of 0.420 and weighted average of 16.3%. Similarly, the statistical analysis conducted on geographies consisting of 74,290,299 people shows a poor positive correlation between the proportion of Immigrants from North Macedonia and percentage of households with 3 or more vehicles available in the United States with a correlation coefficient (R) of 0.108 and weighted average of 18.4%, a difference of 12.6%.
3 or more Vehicles in Household Correlation Summary
| Measurement | Immigrants from Morocco | Immigrants from North Macedonia |
| Minimum | 7.9% | 12.9% |
| Maximum | 46.2% | 37.6% |
| Range | 38.2% | 24.7% |
| Mean | 18.3% | 21.3% |
| Median | 15.6% | 20.5% |
| Interquartile 25% (IQ1) | 11.8% | 17.2% |
| Interquartile 75% (IQ3) | 19.8% | 24.0% |
| Interquartile Range (IQR) | 8.0% | 6.8% |
| Standard Deviation (Sample) | 9.6% | 6.1% |
| Standard Deviation (Population) | 9.5% | 6.1% |
Similar Demographics by 3 or more Vehicles in Household
Demographics Similar to Immigrants from Morocco by 3 or more Vehicles in Household
In terms of 3 or more vehicles in household, the demographic groups most similar to Immigrants from Morocco are Ghanaian (16.4%, a difference of 0.26%), Immigrants from Serbia (16.4%, a difference of 0.74%), Somali (16.2%, a difference of 0.82%), Immigrants from Ghana (16.2%, a difference of 0.96%), and Immigrants from Greece (16.5%, a difference of 1.0%).
| Demographics | Rating | Rank | 3 or more Vehicles in Household |
| Immigrants | Zaire | 0.1 /100 | #298 | Tragic 16.7% |
| Immigrants | South America | 0.1 /100 | #299 | Tragic 16.7% |
| Cypriots | 0.0 /100 | #300 | Tragic 16.6% |
| Paraguayans | 0.0 /100 | #301 | Tragic 16.6% |
| Immigrants | Greece | 0.0 /100 | #302 | Tragic 16.5% |
| Immigrants | Serbia | 0.0 /100 | #303 | Tragic 16.4% |
| Ghanaians | 0.0 /100 | #304 | Tragic 16.4% |
| Immigrants | Morocco | 0.0 /100 | #305 | Tragic 16.3% |
| Somalis | 0.0 /100 | #306 | Tragic 16.2% |
| Immigrants | Ghana | 0.0 /100 | #307 | Tragic 16.2% |
| Houma | 0.0 /100 | #308 | Tragic 16.1% |
| Immigrants | Somalia | 0.0 /100 | #309 | Tragic 15.9% |
| Moroccans | 0.0 /100 | #310 | Tragic 15.9% |
| Albanians | 0.0 /100 | #311 | Tragic 15.8% |
| Puerto Ricans | 0.0 /100 | #312 | Tragic 15.6% |
Demographics Similar to Immigrants from North Macedonia by 3 or more Vehicles in Household
In terms of 3 or more vehicles in household, the demographic groups most similar to Immigrants from North Macedonia are Honduran (18.4%, a difference of 0.070%), Immigrants from Uganda (18.4%, a difference of 0.080%), Immigrants from Belgium (18.4%, a difference of 0.15%), Immigrants from Western Asia (18.4%, a difference of 0.17%), and Immigrants from Switzerland (18.4%, a difference of 0.23%).
| Demographics | Rating | Rank | 3 or more Vehicles in Household |
| Immigrants | Singapore | 5.4 /100 | #227 | Tragic 18.4% |
| Turks | 5.4 /100 | #228 | Tragic 18.4% |
| Immigrants | Switzerland | 5.0 /100 | #229 | Tragic 18.4% |
| Immigrants | Western Asia | 4.8 /100 | #230 | Tragic 18.4% |
| Immigrants | Belgium | 4.8 /100 | #231 | Tragic 18.4% |
| Immigrants | Uganda | 4.6 /100 | #232 | Tragic 18.4% |
| Hondurans | 4.6 /100 | #233 | Tragic 18.4% |
| Immigrants | North Macedonia | 4.4 /100 | #234 | Tragic 18.4% |
| Sierra Leoneans | 3.9 /100 | #235 | Tragic 18.3% |
| Immigrants | Malaysia | 3.6 /100 | #236 | Tragic 18.3% |
| Indonesians | 3.5 /100 | #237 | Tragic 18.3% |
| Immigrants | Honduras | 3.1 /100 | #238 | Tragic 18.2% |
| Immigrants | Middle Africa | 3.1 /100 | #239 | Tragic 18.2% |
| Immigrants | China | 2.9 /100 | #240 | Tragic 18.2% |
| Africans | 2.7 /100 | #241 | Tragic 18.2% |