Immigrants from Cameroon vs Immigrants from North Macedonia 3 or more Vehicles in Household
COMPARE
Immigrants from Cameroon
Immigrants from North Macedonia
3 or more Vehicles in Household
3 or more Vehicles in Household Comparison
Immigrants from Cameroon
Immigrants from North Macedonia
19.7%
3 OR MORE VEHICLES IN HOUSEHOLD
60.9/ 100
METRIC RATING
166th/ 347
METRIC RANK
18.4%
3 OR MORE VEHICLES IN HOUSEHOLD
4.4/ 100
METRIC RATING
234th/ 347
METRIC RANK
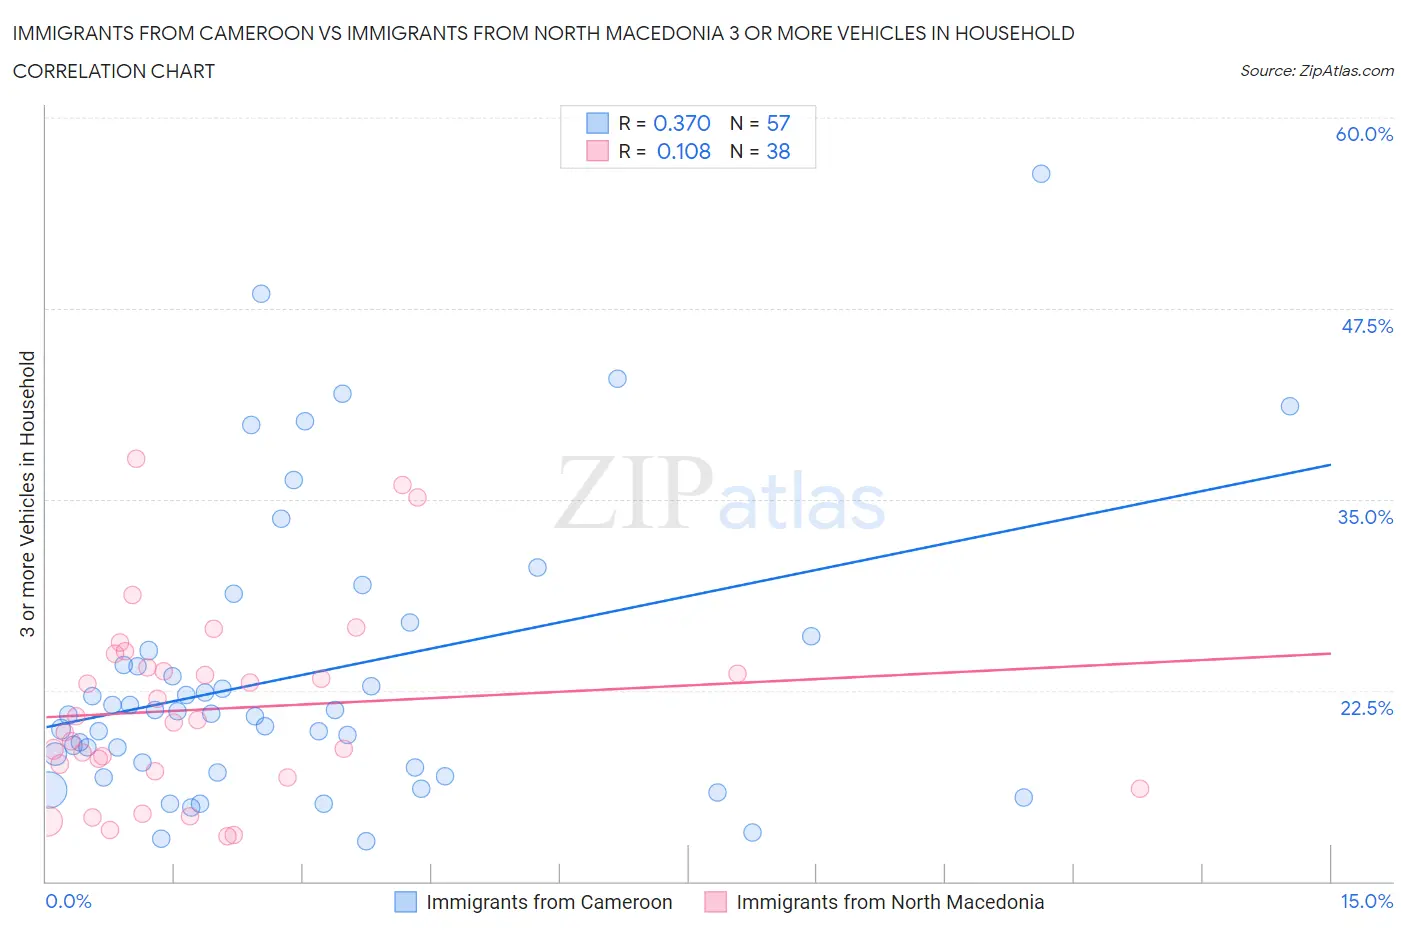
Immigrants from Cameroon vs Immigrants from North Macedonia 3 or more Vehicles in Household Correlation Chart
The statistical analysis conducted on geographies consisting of 130,731,455 people shows a mild positive correlation between the proportion of Immigrants from Cameroon and percentage of households with 3 or more vehicles available in the United States with a correlation coefficient (R) of 0.370 and weighted average of 19.7%. Similarly, the statistical analysis conducted on geographies consisting of 74,290,299 people shows a poor positive correlation between the proportion of Immigrants from North Macedonia and percentage of households with 3 or more vehicles available in the United States with a correlation coefficient (R) of 0.108 and weighted average of 18.4%, a difference of 7.0%.
3 or more Vehicles in Household Correlation Summary
| Measurement | Immigrants from Cameroon | Immigrants from North Macedonia |
| Minimum | 12.6% | 12.9% |
| Maximum | 56.3% | 37.6% |
| Range | 43.7% | 24.7% |
| Mean | 23.5% | 21.3% |
| Median | 20.9% | 20.5% |
| Interquartile 25% (IQ1) | 17.3% | 17.2% |
| Interquartile 75% (IQ3) | 25.6% | 24.0% |
| Interquartile Range (IQR) | 8.3% | 6.8% |
| Standard Deviation (Sample) | 9.4% | 6.1% |
| Standard Deviation (Population) | 9.3% | 6.1% |
Similar Demographics by 3 or more Vehicles in Household
Demographics Similar to Immigrants from Cameroon by 3 or more Vehicles in Household
In terms of 3 or more vehicles in household, the demographic groups most similar to Immigrants from Cameroon are Immigrants from Costa Rica (19.7%, a difference of 0.080%), Yugoslavian (19.7%, a difference of 0.16%), Ukrainian (19.6%, a difference of 0.16%), Chilean (19.7%, a difference of 0.17%), and Peruvian (19.6%, a difference of 0.17%).
| Demographics | Rating | Rank | 3 or more Vehicles in Household |
| Immigrants | Pakistan | 68.2 /100 | #159 | Good 19.8% |
| Immigrants | Lebanon | 67.6 /100 | #160 | Good 19.8% |
| Immigrants | Guatemala | 65.6 /100 | #161 | Good 19.7% |
| Estonians | 63.2 /100 | #162 | Good 19.7% |
| Chileans | 63.0 /100 | #163 | Good 19.7% |
| Yugoslavians | 62.9 /100 | #164 | Good 19.7% |
| Immigrants | Costa Rica | 61.9 /100 | #165 | Good 19.7% |
| Immigrants | Cameroon | 60.9 /100 | #166 | Good 19.7% |
| Ukrainians | 58.9 /100 | #167 | Average 19.6% |
| Peruvians | 58.8 /100 | #168 | Average 19.6% |
| Immigrants | Denmark | 57.6 /100 | #169 | Average 19.6% |
| Iraqis | 56.0 /100 | #170 | Average 19.6% |
| Immigrants | Western Europe | 53.2 /100 | #171 | Average 19.5% |
| Kiowa | 50.9 /100 | #172 | Average 19.5% |
| Immigrants | Northern Europe | 50.2 /100 | #173 | Average 19.5% |
Demographics Similar to Immigrants from North Macedonia by 3 or more Vehicles in Household
In terms of 3 or more vehicles in household, the demographic groups most similar to Immigrants from North Macedonia are Honduran (18.4%, a difference of 0.070%), Immigrants from Uganda (18.4%, a difference of 0.080%), Immigrants from Belgium (18.4%, a difference of 0.15%), Immigrants from Western Asia (18.4%, a difference of 0.17%), and Immigrants from Switzerland (18.4%, a difference of 0.23%).
| Demographics | Rating | Rank | 3 or more Vehicles in Household |
| Immigrants | Singapore | 5.4 /100 | #227 | Tragic 18.4% |
| Turks | 5.4 /100 | #228 | Tragic 18.4% |
| Immigrants | Switzerland | 5.0 /100 | #229 | Tragic 18.4% |
| Immigrants | Western Asia | 4.8 /100 | #230 | Tragic 18.4% |
| Immigrants | Belgium | 4.8 /100 | #231 | Tragic 18.4% |
| Immigrants | Uganda | 4.6 /100 | #232 | Tragic 18.4% |
| Hondurans | 4.6 /100 | #233 | Tragic 18.4% |
| Immigrants | North Macedonia | 4.4 /100 | #234 | Tragic 18.4% |
| Sierra Leoneans | 3.9 /100 | #235 | Tragic 18.3% |
| Immigrants | Malaysia | 3.6 /100 | #236 | Tragic 18.3% |
| Indonesians | 3.5 /100 | #237 | Tragic 18.3% |
| Immigrants | Honduras | 3.1 /100 | #238 | Tragic 18.2% |
| Immigrants | Middle Africa | 3.1 /100 | #239 | Tragic 18.2% |
| Immigrants | China | 2.9 /100 | #240 | Tragic 18.2% |
| Africans | 2.7 /100 | #241 | Tragic 18.2% |