Seminole vs Immigrants from Israel 3 or more Vehicles in Household

COMPARE

Seminole
Race
Ancestry
AfghanAfricanAlaska NativeAlaskan AthabascanAlbanianAleutAlsatianAmericanApacheArabArapahoArgentineanArmenianAssyrian/Chaldean/SyriacAustralianAustrianBahamianBangladeshiBarbadianBasqueBelgianBelizeanBermudanBhutaneseBlackfeetBolivianBrazilianBritishBritish West IndianBulgarianBurmeseCajunCambodianCanadianCape VerdeanCarpatho RusynCelticCentral AmericanCentral American IndianCherokeeCheyenneChickasawChileanChineseChippewaChoctawColombianColvilleComancheCosta RicanCreeCreekCroatianCrowCubanCypriotCzechCzechoslovakianDanishDelawareDominicanDutchDutch West IndianEastern EuropeanEcuadorianEgyptianEnglishEstonianEthiopianEuropeanFijianFilipinoFinnishFrenchFrench American IndianFrench CanadianGermanGerman RussianGhanaianGreekGuamanian/ChamorroGuatemalanGuyaneseHaitianHmongHonduranHopiHoumaHungarianIcelanderIndian (Asian)IndonesianInupiatIranianIraqiIrishIroquoisIsraeliItalianJamaicanJapaneseJordanianKenyanKiowaKoreanLaotianLatvianLebaneseLiberianLithuanianLumbeeLuxembourgerMacedonianMalaysianMalteseMarshalleseMenomineeMexicanMexican American IndianMongolianMoroccanNative HawaiianNavajoNepaleseNew ZealanderNicaraguanNigerianNorthern EuropeanNorwegianOkinawanOsageOttawaPaiutePakistaniPalestinianPanamanianParaguayanPennsylvania GermanPeruvianPimaPolishPortuguesePotawatomiPuebloPuerto RicanPuget Sound SalishRomanianRussianSalvadoranSamoanScandinavianScotch-IrishScottishSeminoleSenegaleseSerbianShoshoneSierra LeoneanSiouxSlavicSlovakSloveneSomaliSouth AfricanSouth AmericanSouth American IndianSoviet UnionSpaniardSpanishSpanish AmericanSpanish American IndianSri LankanSubsaharan AfricanSudaneseSwedishSwissSyrianTaiwaneseThaiTlingit-HaidaTohono O'OdhamTonganTrinidadian and TobagonianTsimshianTurkishU.S. Virgin IslanderUgandanUkrainianUruguayanUteVenezuelanVietnameseWelshWest IndianYakamaYaquiYugoslavianYumanYup'ikZimbabwean
Immigration
NonimmigrantsImmigrantsAfghanistanAfricaAlbaniaArgentinaArmeniaAsiaAustraliaAustriaBahamasBangladeshBarbadosBelarusBelgiumBelizeBoliviaBosnia and HerzegovinaBrazilBulgariaBurma/MyanmarCabo VerdeCambodiaCameroonCanadaCaribbeanCentral AmericaChileChinaColombiaCongoCosta RicaCroatiaCubaCzechoslovakiaDenmarkDominicaDominican RepublicEastern AfricaEastern AsiaEastern EuropeEcuadorEgyptEl SalvadorEnglandEritreaEthiopiaEuropeFijiFranceGermanyGhanaGreeceGrenadaGuatemalaGuyanaHaitiHondurasHong KongHungaryIndiaIndonesiaIranIraqIrelandItalyJamaicaJapanJordanKazakhstanKenyaKoreaKuwaitLaosLatin AmericaLatviaLebanonLiberiaLithuaniaMalaysiaMexicoMicronesiaMiddle AfricaMoldovaMoroccoNepalNetherlandsNicaraguaNigeriaNorth AmericaNorth MacedoniaNorthern AfricaNorthern EuropeNorwayOceaniaPakistanPanamaPeruPhilippinesPolandPortugalRomaniaRussiaSaudi ArabiaScotlandSenegalSerbiaSierra LeoneSingaporeSomaliaSouth AfricaSouth AmericaSouth Central AsiaSouth Eastern AsiaSouthern EuropeSpainSri LankaSt. Vincent and the GrenadinesSudanSwedenSwitzerlandSyriaTaiwanThailandTrinidad and TobagoTurkeyUgandaUkraineUruguayUzbekistanVenezuelaVietnamWest IndiesWestern AfricaWestern AsiaWestern EuropeYemenZaireZimbabweAzores
Immigrants from Israel
Race
Ancestry
AfghanAfricanAlaska NativeAlaskan AthabascanAlbanianAleutAlsatianAmericanApacheArabArapahoArgentineanArmenianAssyrian/Chaldean/SyriacAustralianAustrianBahamianBangladeshiBarbadianBasqueBelgianBelizeanBermudanBhutaneseBlackfeetBolivianBrazilianBritishBritish West IndianBulgarianBurmeseCajunCambodianCanadianCape VerdeanCarpatho RusynCelticCentral AmericanCentral American IndianCherokeeCheyenneChickasawChileanChineseChippewaChoctawColombianColvilleComancheCosta RicanCreeCreekCroatianCrowCubanCypriotCzechCzechoslovakianDanishDelawareDominicanDutchDutch West IndianEastern EuropeanEcuadorianEgyptianEnglishEstonianEthiopianEuropeanFijianFilipinoFinnishFrenchFrench American IndianFrench CanadianGermanGerman RussianGhanaianGreekGuamanian/ChamorroGuatemalanGuyaneseHaitianHmongHonduranHopiHoumaHungarianIcelanderIndian (Asian)IndonesianInupiatIranianIraqiIrishIroquoisIsraeliItalianJamaicanJapaneseJordanianKenyanKiowaKoreanLaotianLatvianLebaneseLiberianLithuanianLumbeeLuxembourgerMacedonianMalaysianMalteseMarshalleseMenomineeMexicanMexican American IndianMongolianMoroccanNative HawaiianNavajoNepaleseNew ZealanderNicaraguanNigerianNorthern EuropeanNorwegianOkinawanOsageOttawaPaiutePakistaniPalestinianPanamanianParaguayanPennsylvania GermanPeruvianPimaPolishPortuguesePotawatomiPuebloPuerto RicanPuget Sound SalishRomanianRussianSalvadoranSamoanScandinavianScotch-IrishScottishSenegaleseSerbianShoshoneSierra LeoneanSiouxSlavicSlovakSloveneSomaliSouth AfricanSouth AmericanSouth American IndianSoviet UnionSpaniardSpanishSpanish AmericanSpanish American IndianSri LankanSubsaharan AfricanSudaneseSwedishSwissSyrianTaiwaneseThaiTlingit-HaidaTohono O'OdhamTonganTrinidadian and TobagonianTsimshianTurkishU.S. Virgin IslanderUgandanUkrainianUruguayanUteVenezuelanVietnameseWelshWest IndianYakamaYaquiYugoslavianYumanYup'ikZimbabwean
Immigration
NonimmigrantsImmigrantsAfghanistanAfricaAlbaniaArgentinaArmeniaAsiaAustraliaAustriaBahamasBangladeshBarbadosBelarusBelgiumBelizeBoliviaBosnia and HerzegovinaBrazilBulgariaBurma/MyanmarCabo VerdeCambodiaCameroonCanadaCaribbeanCentral AmericaChileChinaColombiaCongoCosta RicaCroatiaCubaCzechoslovakiaDenmarkDominicaDominican RepublicEastern AfricaEastern AsiaEastern EuropeEcuadorEgyptEl SalvadorEnglandEritreaEthiopiaEuropeFijiFranceGermanyGhanaGreeceGrenadaGuatemalaGuyanaHaitiHondurasHong KongHungaryIndiaIndonesiaIranIraqIrelandIsraelItalyJamaicaJapanJordanKazakhstanKenyaKoreaKuwaitLaosLatin AmericaLatviaLebanonLiberiaLithuaniaMalaysiaMexicoMicronesiaMiddle AfricaMoldovaMoroccoNepalNetherlandsNicaraguaNigeriaNorth AmericaNorth MacedoniaNorthern AfricaNorthern EuropeNorwayOceaniaPakistanPanamaPeruPhilippinesPolandPortugalRomaniaRussiaSaudi ArabiaScotlandSenegalSerbiaSierra LeoneSingaporeSomaliaSouth AfricaSouth AmericaSouth Central AsiaSouth Eastern AsiaSouthern EuropeSpainSri LankaSt. Vincent and the GrenadinesSudanSwedenSwitzerlandSyriaTaiwanThailandTrinidad and TobagoTurkeyUgandaUkraineUruguayUzbekistanVenezuelaVietnamWest IndiesWestern AfricaWestern AsiaWestern EuropeYemenZaireZimbabweAzores
3 or more Vehicles in Household
Income
Poverty
Unemployment
Labor Participation
Family Structure
Vehicle Availability
Education Level
Disability

3 or more Vehicles in Household Comparison

Seminole

Immigrants from Israel

Exceptional
Tragic
20.9%
3 OR MORE VEHICLES IN HOUSEHOLD
97.8/ 100
METRIC RATING
102nd/ 347
METRIC RANK
15.6%
3 OR MORE VEHICLES IN HOUSEHOLD
0.0/ 100
METRIC RATING
313th/ 347
METRIC RANK

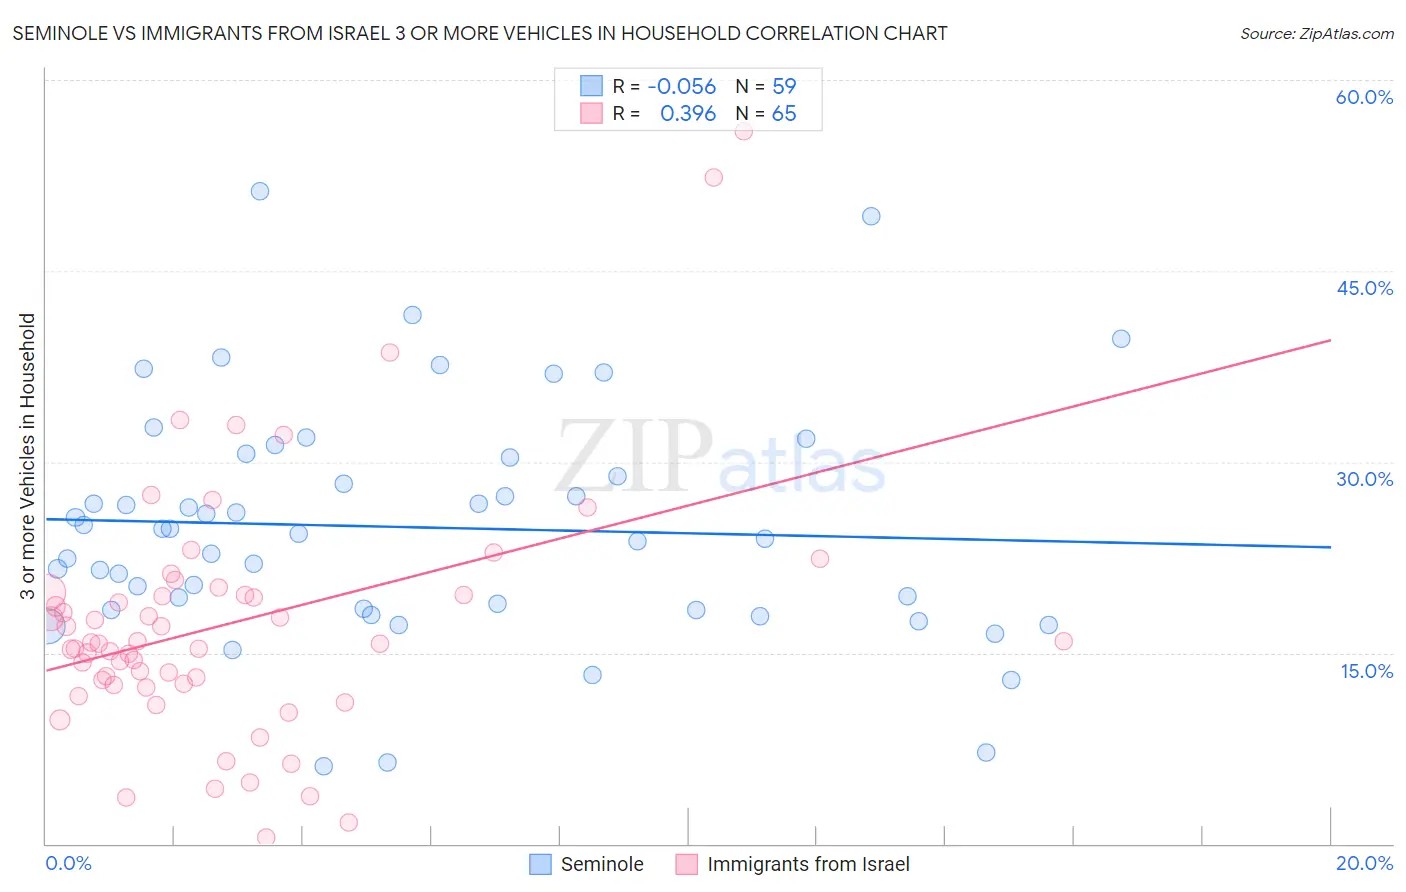
Seminole vs Immigrants from Israel 3 or more Vehicles in Household Correlation Chart

The statistical analysis conducted on geographies consisting of 118,297,727 people shows a slight negative correlation between the proportion of Seminole and percentage of households with 3 or more vehicles available in the United States with a correlation coefficient (R) of -0.056 and weighted average of 20.9%. Similarly, the statistical analysis conducted on geographies consisting of 209,931,156 people shows a mild positive correlation between the proportion of Immigrants from Israel and percentage of households with 3 or more vehicles available in the United States with a correlation coefficient (R) of 0.396 and weighted average of 15.6%, a difference of 33.8%.
Seminole vs Immigrants from Israel 3 or more Vehicles in Household

3 or more Vehicles in Household Correlation Summary

MeasurementSeminoleImmigrants from Israel
Minimum6.1%0.45%
Maximum51.2%55.9%
Range45.1%55.5%
Mean24.9%17.3%
Median24.4%15.7%
Interquartile 25% (IQ1)18.4%12.5%
Interquartile 75% (IQ3)30.3%19.6%
Interquartile Range (IQR)11.9%7.1%
Standard Deviation (Sample)9.3%9.9%
Standard Deviation (Population)9.2%9.9%

Similar Demographics by 3 or more Vehicles in Household

Demographics Similar to Seminole by 3 or more Vehicles in Household

In terms of 3 or more vehicles in household, the demographic groups most similar to Seminole are Blackfeet (20.9%, a difference of 0.030%), Dutch West Indian (20.9%, a difference of 0.040%), Luxembourger (20.9%, a difference of 0.12%), Austrian (20.9%, a difference of 0.23%), and Bolivian (20.8%, a difference of 0.32%).
DemographicsRating | Rank3 or more Vehicles in Household
Pakistanis
98.5
/100
|
#95
Exceptional
21.0%
Cree
98.4
/100
|
#96
Exceptional
21.0%
Canadians
98.3
/100
|
#97
Exceptional
21.0%
Hmong
98.2
/100
|
#98
Exceptional
21.0%
Alaska Natives
98.2
/100
|
#99
Exceptional
21.0%
Comanche
98.2
/100
|
#100
Exceptional
21.0%
Blackfeet
97.9
/100
|
#101
Exceptional
20.9%
Seminole
97.8
/100
|
#102
Exceptional
20.9%
Dutch West Indians
97.8
/100
|
#103
Exceptional
20.9%
Luxembourgers
97.7
/100
|
#104
Exceptional
20.9%
Austrians
97.5
/100
|
#105
Exceptional
20.9%
Bolivians
97.4
/100
|
#106
Exceptional
20.8%
Immigrants | Germany
97.4
/100
|
#107
Exceptional
20.8%
Immigrants | Scotland
97.1
/100
|
#108
Exceptional
20.8%
Filipinos
97.0
/100
|
#109
Exceptional
20.8%

Demographics Similar to Immigrants from Israel by 3 or more Vehicles in Household

In terms of 3 or more vehicles in household, the demographic groups most similar to Immigrants from Israel are Puerto Rican (15.6%, a difference of 0.020%), Immigrants from Belarus (15.5%, a difference of 0.64%), Haitian (15.5%, a difference of 0.96%), Albanian (15.8%, a difference of 1.2%), and U.S. Virgin Islander (15.4%, a difference of 1.5%).
DemographicsRating | Rank3 or more Vehicles in Household
Somalis
0.0
/100
|
#306
Tragic
16.2%
Immigrants | Ghana
0.0
/100
|
#307
Tragic
16.2%
Houma
0.0
/100
|
#308
Tragic
16.1%
Immigrants | Somalia
0.0
/100
|
#309
Tragic
15.9%
Moroccans
0.0
/100
|
#310
Tragic
15.9%
Albanians
0.0
/100
|
#311
Tragic
15.8%
Puerto Ricans
0.0
/100
|
#312
Tragic
15.6%
Immigrants | Israel
0.0
/100
|
#313
Tragic
15.6%
Immigrants | Belarus
0.0
/100
|
#314
Tragic
15.5%
Haitians
0.0
/100
|
#315
Tragic
15.5%
U.S. Virgin Islanders
0.0
/100
|
#316
Tragic
15.4%
Jamaicans
0.0
/100
|
#317
Tragic
15.2%
Immigrants | Haiti
0.0
/100
|
#318
Tragic
15.2%
Cape Verdeans
0.0
/100
|
#319
Tragic
15.0%
Yup'ik
0.0
/100
|
#320
Tragic
14.8%