Salvadoran vs Immigrants from Eritrea 3 or more Vehicles in Household
COMPARE
Salvadoran
Immigrants from Eritrea
3 or more Vehicles in Household
3 or more Vehicles in Household Comparison
Salvadorans
Immigrants from Eritrea
21.8%
3 OR MORE VEHICLES IN HOUSEHOLD
99.8/ 100
METRIC RATING
73rd/ 347
METRIC RANK
17.8%
3 OR MORE VEHICLES IN HOUSEHOLD
1.1/ 100
METRIC RATING
257th/ 347
METRIC RANK
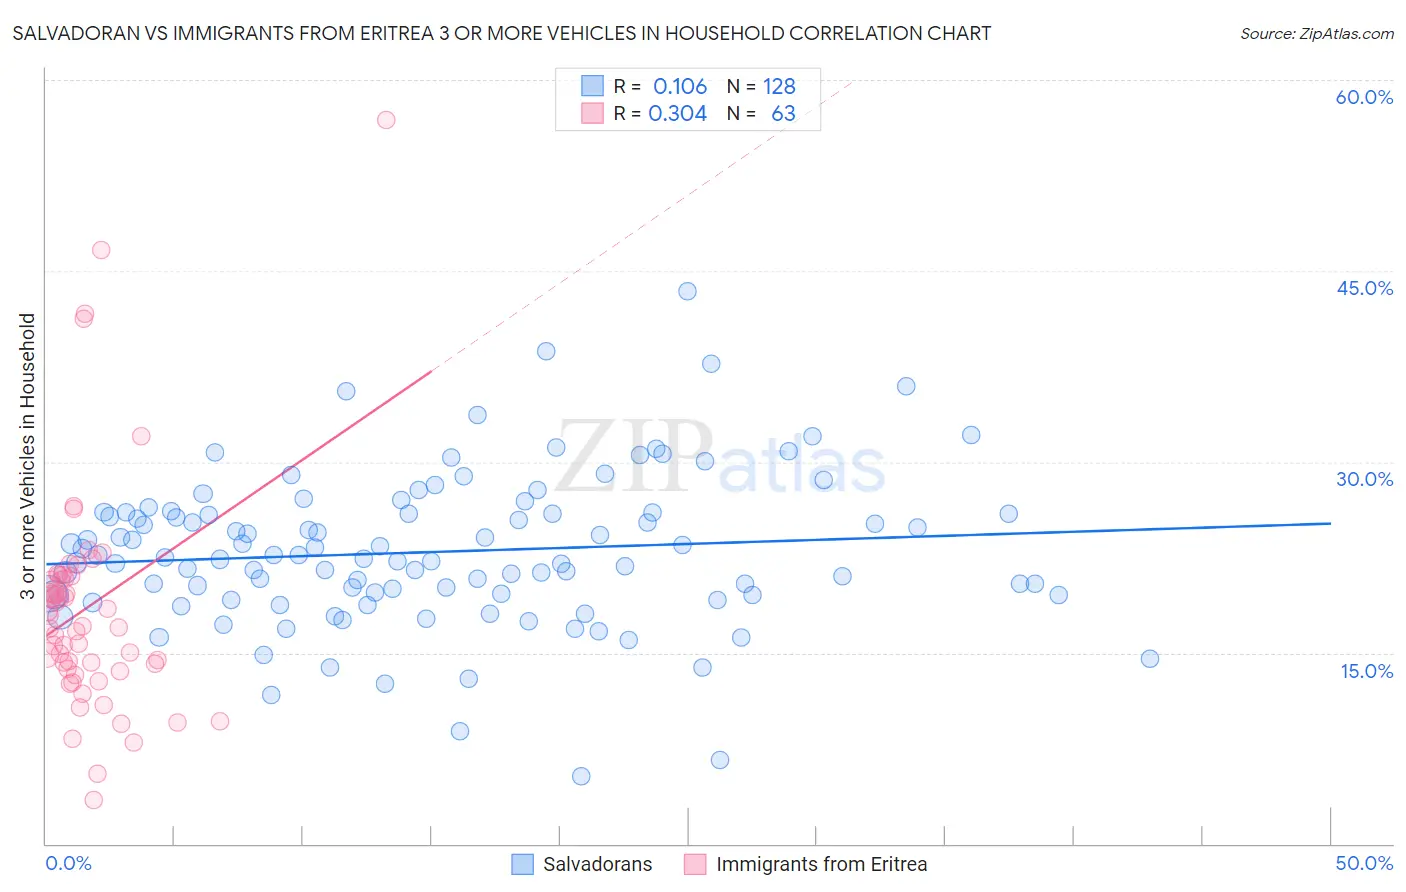
Salvadoran vs Immigrants from Eritrea 3 or more Vehicles in Household Correlation Chart
The statistical analysis conducted on geographies consisting of 398,656,904 people shows a poor positive correlation between the proportion of Salvadorans and percentage of households with 3 or more vehicles available in the United States with a correlation coefficient (R) of 0.106 and weighted average of 21.8%. Similarly, the statistical analysis conducted on geographies consisting of 104,844,595 people shows a mild positive correlation between the proportion of Immigrants from Eritrea and percentage of households with 3 or more vehicles available in the United States with a correlation coefficient (R) of 0.304 and weighted average of 17.8%, a difference of 22.2%.
3 or more Vehicles in Household Correlation Summary
| Measurement | Salvadoran | Immigrants from Eritrea |
| Minimum | 5.3% | 3.4% |
| Maximum | 43.4% | 56.8% |
| Range | 38.2% | 53.4% |
| Mean | 22.9% | 18.6% |
| Median | 22.4% | 17.0% |
| Interquartile 25% (IQ1) | 19.6% | 13.8% |
| Interquartile 75% (IQ3) | 26.0% | 21.0% |
| Interquartile Range (IQR) | 6.4% | 7.2% |
| Standard Deviation (Sample) | 6.0% | 9.1% |
| Standard Deviation (Population) | 6.0% | 9.0% |
Similar Demographics by 3 or more Vehicles in Household
Demographics Similar to Salvadorans by 3 or more Vehicles in Household
In terms of 3 or more vehicles in household, the demographic groups most similar to Salvadorans are Immigrants from Oceania (21.8%, a difference of 0.020%), Portuguese (21.8%, a difference of 0.090%), Japanese (21.8%, a difference of 0.12%), Nonimmigrants (21.8%, a difference of 0.16%), and Irish (21.8%, a difference of 0.24%).
| Demographics | Rating | Rank | 3 or more Vehicles in Household |
| Northern Europeans | 99.9 /100 | #66 | Exceptional 22.0% |
| Alaskan Athabascans | 99.9 /100 | #67 | Exceptional 21.9% |
| British | 99.9 /100 | #68 | Exceptional 21.9% |
| Creek | 99.9 /100 | #69 | Exceptional 21.9% |
| Bangladeshis | 99.8 /100 | #70 | Exceptional 21.9% |
| Potawatomi | 99.8 /100 | #71 | Exceptional 21.9% |
| Portuguese | 99.8 /100 | #72 | Exceptional 21.8% |
| Salvadorans | 99.8 /100 | #73 | Exceptional 21.8% |
| Immigrants | Oceania | 99.8 /100 | #74 | Exceptional 21.8% |
| Japanese | 99.8 /100 | #75 | Exceptional 21.8% |
| Immigrants | Nonimmigrants | 99.8 /100 | #76 | Exceptional 21.8% |
| Irish | 99.8 /100 | #77 | Exceptional 21.8% |
| Czechoslovakians | 99.8 /100 | #78 | Exceptional 21.7% |
| Assyrians/Chaldeans/Syriacs | 99.8 /100 | #79 | Exceptional 21.7% |
| Afghans | 99.7 /100 | #80 | Exceptional 21.7% |
Demographics Similar to Immigrants from Eritrea by 3 or more Vehicles in Household
In terms of 3 or more vehicles in household, the demographic groups most similar to Immigrants from Eritrea are Sudanese (17.8%, a difference of 0.0%), Subsaharan African (17.9%, a difference of 0.050%), Immigrants from Turkey (17.9%, a difference of 0.20%), Uruguayan (17.8%, a difference of 0.22%), and Immigrants from Ethiopia (17.9%, a difference of 0.23%).
| Demographics | Rating | Rank | 3 or more Vehicles in Household |
| Venezuelans | 1.7 /100 | #250 | Tragic 18.0% |
| Alsatians | 1.5 /100 | #251 | Tragic 18.0% |
| Immigrants | Southern Europe | 1.4 /100 | #252 | Tragic 17.9% |
| Immigrants | Ethiopia | 1.3 /100 | #253 | Tragic 17.9% |
| Ethiopians | 1.2 /100 | #254 | Tragic 17.9% |
| Immigrants | Turkey | 1.2 /100 | #255 | Tragic 17.9% |
| Sub-Saharan Africans | 1.1 /100 | #256 | Tragic 17.9% |
| Immigrants | Eritrea | 1.1 /100 | #257 | Tragic 17.8% |
| Sudanese | 1.1 /100 | #258 | Tragic 17.8% |
| Uruguayans | 1.0 /100 | #259 | Tragic 17.8% |
| Ugandans | 0.9 /100 | #260 | Tragic 17.8% |
| Immigrants | Northern Africa | 0.9 /100 | #261 | Tragic 17.8% |
| Colombians | 0.9 /100 | #262 | Tragic 17.8% |
| Bermudans | 0.9 /100 | #263 | Tragic 17.8% |
| Cambodians | 0.9 /100 | #264 | Tragic 17.8% |