Salvadoran vs Immigrants from Eritrea Female Disability
COMPARE
Salvadoran
Immigrants from Eritrea
Female Disability
Female Disability Comparison
Salvadorans
Immigrants from Eritrea
11.5%
FEMALE DISABILITY
99.8/ 100
METRIC RATING
66th/ 347
METRIC RANK
11.5%
FEMALE DISABILITY
99.7/ 100
METRIC RATING
76th/ 347
METRIC RANK
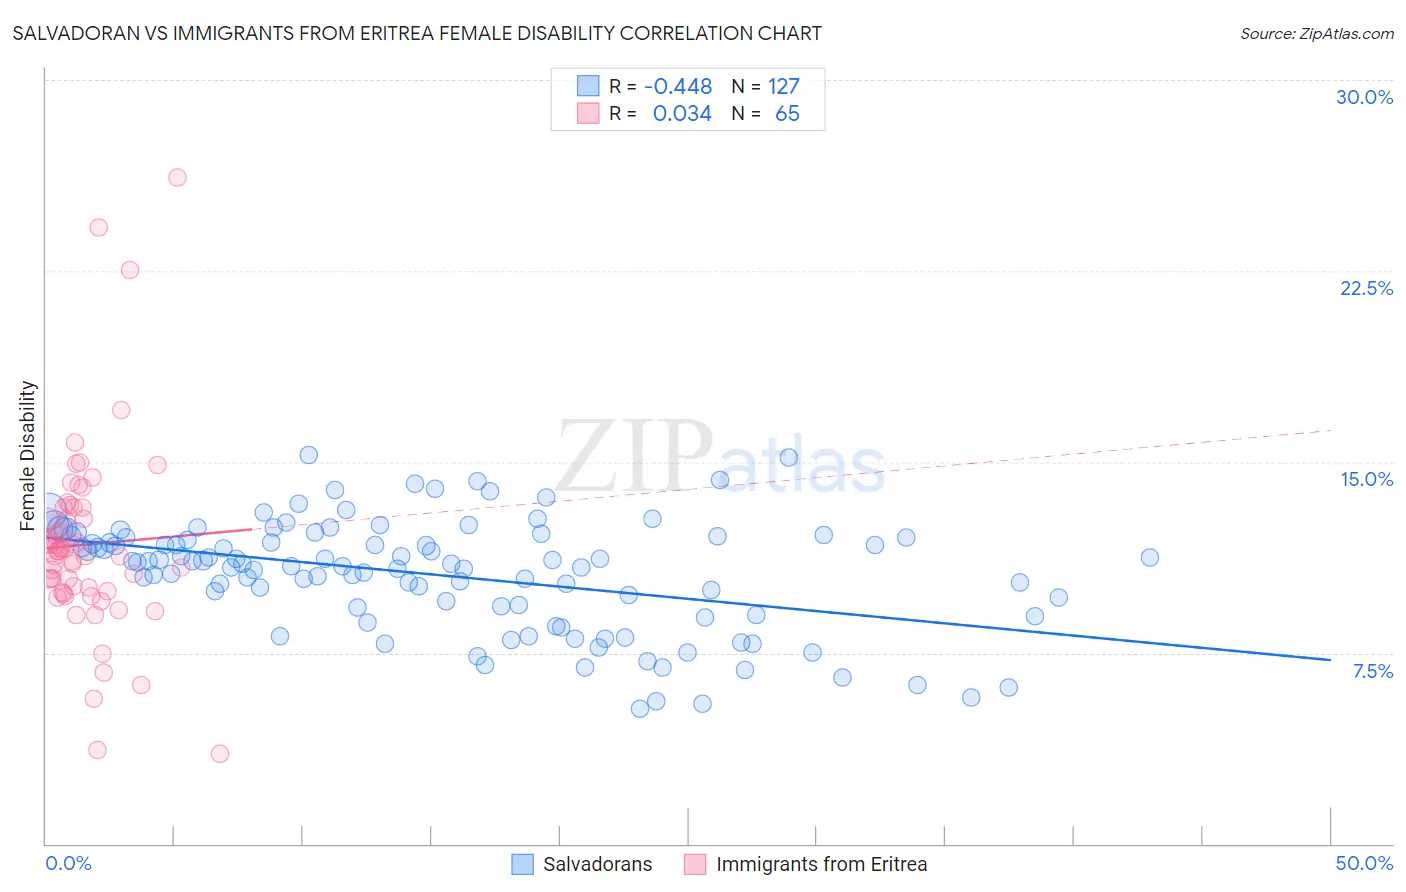
Salvadoran vs Immigrants from Eritrea Female Disability Correlation Chart
The statistical analysis conducted on geographies consisting of 398,928,715 people shows a moderate negative correlation between the proportion of Salvadorans and percentage of females with a disability in the United States with a correlation coefficient (R) of -0.448 and weighted average of 11.5%. Similarly, the statistical analysis conducted on geographies consisting of 104,854,458 people shows no correlation between the proportion of Immigrants from Eritrea and percentage of females with a disability in the United States with a correlation coefficient (R) of 0.034 and weighted average of 11.5%, a difference of 0.51%.
Female Disability Correlation Summary
| Measurement | Salvadoran | Immigrants from Eritrea |
| Minimum | 5.3% | 3.5% |
| Maximum | 15.3% | 26.2% |
| Range | 9.9% | 22.7% |
| Mean | 10.6% | 11.7% |
| Median | 11.0% | 11.5% |
| Interquartile 25% (IQ1) | 9.3% | 9.9% |
| Interquartile 75% (IQ3) | 12.0% | 13.2% |
| Interquartile Range (IQR) | 2.8% | 3.3% |
| Standard Deviation (Sample) | 2.2% | 3.8% |
| Standard Deviation (Population) | 2.2% | 3.7% |
Demographics Similar to Salvadorans and Immigrants from Eritrea by Female Disability
In terms of female disability, the demographic groups most similar to Salvadorans are Immigrants from Vietnam (11.5%, a difference of 0.050%), Immigrants from Northern Africa (11.5%, a difference of 0.060%), Colombian (11.5%, a difference of 0.14%), Immigrants from Chile (11.5%, a difference of 0.15%), and Immigrants from South America (11.4%, a difference of 0.17%). Similarly, the demographic groups most similar to Immigrants from Eritrea are Immigrants from Afghanistan (11.5%, a difference of 0.0%), Immigrants from South Africa (11.5%, a difference of 0.010%), Immigrants from Lebanon (11.5%, a difference of 0.030%), Sierra Leonean (11.5%, a difference of 0.030%), and Immigrants from Jordan (11.5%, a difference of 0.040%).
| Demographics | Rating | Rank | Female Disability |
| Immigrants | France | 99.9 /100 | #61 | Exceptional 11.4% |
| Sri Lankans | 99.9 /100 | #62 | Exceptional 11.4% |
| Immigrants | Colombia | 99.9 /100 | #63 | Exceptional 11.4% |
| Immigrants | El Salvador | 99.9 /100 | #64 | Exceptional 11.4% |
| Immigrants | South America | 99.9 /100 | #65 | Exceptional 11.4% |
| Salvadorans | 99.8 /100 | #66 | Exceptional 11.5% |
| Immigrants | Vietnam | 99.8 /100 | #67 | Exceptional 11.5% |
| Immigrants | Northern Africa | 99.8 /100 | #68 | Exceptional 11.5% |
| Colombians | 99.8 /100 | #69 | Exceptional 11.5% |
| Immigrants | Chile | 99.8 /100 | #70 | Exceptional 11.5% |
| Immigrants | Ireland | 99.8 /100 | #71 | Exceptional 11.5% |
| Chileans | 99.8 /100 | #72 | Exceptional 11.5% |
| Immigrants | Switzerland | 99.8 /100 | #73 | Exceptional 11.5% |
| Bhutanese | 99.8 /100 | #74 | Exceptional 11.5% |
| Immigrants | Lebanon | 99.7 /100 | #75 | Exceptional 11.5% |
| Immigrants | Eritrea | 99.7 /100 | #76 | Exceptional 11.5% |
| Immigrants | Afghanistan | 99.7 /100 | #77 | Exceptional 11.5% |
| Immigrants | South Africa | 99.7 /100 | #78 | Exceptional 11.5% |
| Sierra Leoneans | 99.7 /100 | #79 | Exceptional 11.5% |
| Immigrants | Jordan | 99.7 /100 | #80 | Exceptional 11.5% |
| Eastern Europeans | 99.7 /100 | #81 | Exceptional 11.5% |