Salvadoran vs Immigrants from Eritrea Divorced or Separated
COMPARE
Salvadoran
Immigrants from Eritrea
Divorced or Separated
Divorced or Separated Comparison
Salvadorans
Immigrants from Eritrea
11.6%
DIVORCED OR SEPARATED
98.2/ 100
METRIC RATING
104th/ 347
METRIC RANK
12.1%
DIVORCED OR SEPARATED
31.9/ 100
METRIC RATING
194th/ 347
METRIC RANK
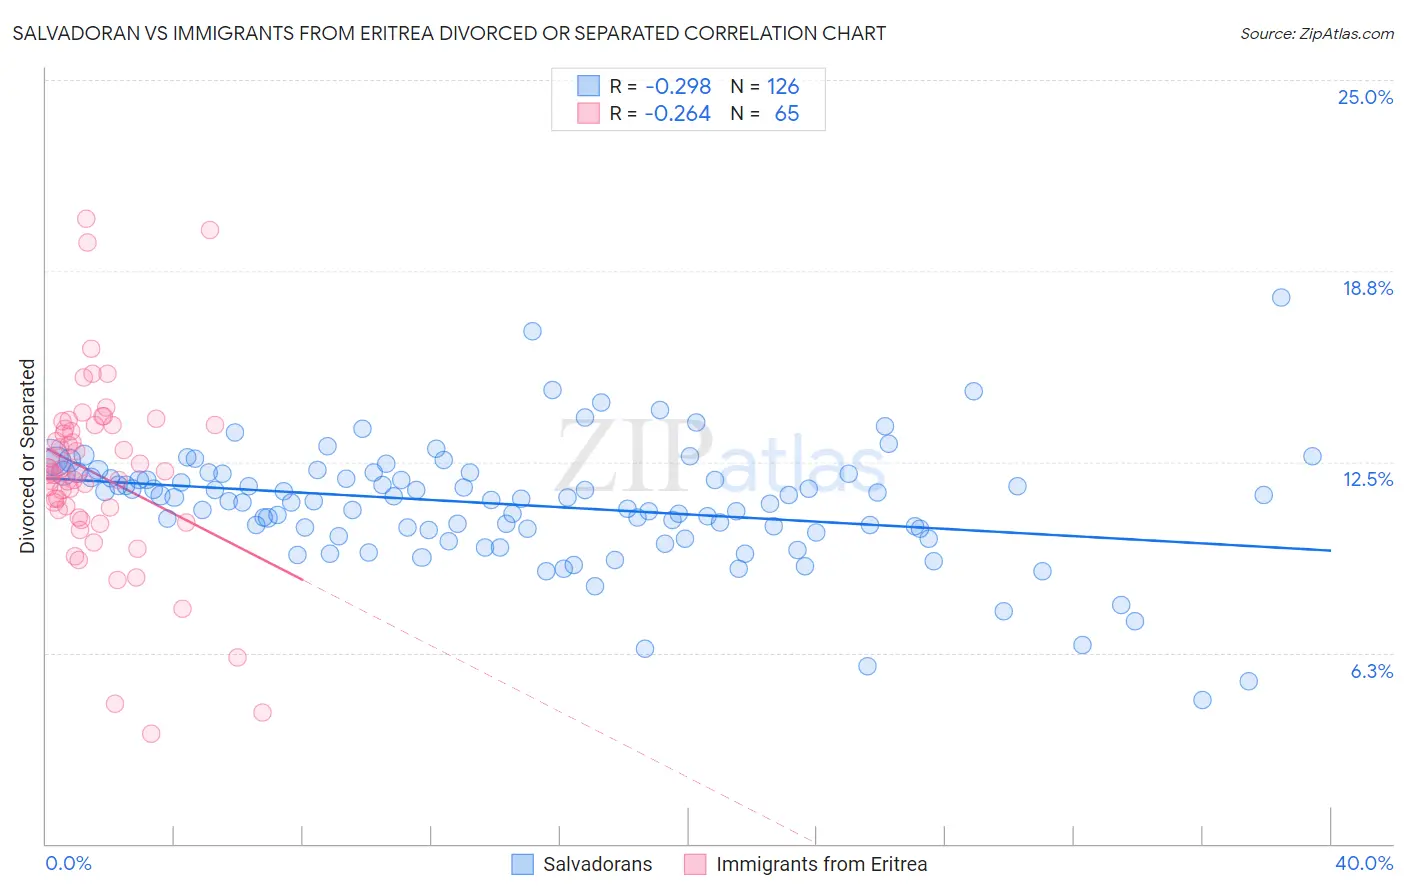
Salvadoran vs Immigrants from Eritrea Divorced or Separated Correlation Chart
The statistical analysis conducted on geographies consisting of 398,863,882 people shows a weak negative correlation between the proportion of Salvadorans and percentage of population currently divorced or separated in the United States with a correlation coefficient (R) of -0.298 and weighted average of 11.6%. Similarly, the statistical analysis conducted on geographies consisting of 104,847,630 people shows a weak negative correlation between the proportion of Immigrants from Eritrea and percentage of population currently divorced or separated in the United States with a correlation coefficient (R) of -0.264 and weighted average of 12.1%, a difference of 4.3%.
Divorced or Separated Correlation Summary
| Measurement | Salvadoran | Immigrants from Eritrea |
| Minimum | 4.7% | 3.6% |
| Maximum | 17.9% | 20.5% |
| Range | 13.2% | 16.9% |
| Mean | 11.1% | 12.1% |
| Median | 11.3% | 12.2% |
| Interquartile 25% (IQ1) | 10.3% | 10.8% |
| Interquartile 75% (IQ3) | 12.1% | 13.7% |
| Interquartile Range (IQR) | 1.8% | 2.9% |
| Standard Deviation (Sample) | 1.9% | 3.1% |
| Standard Deviation (Population) | 1.9% | 3.0% |
Similar Demographics by Divorced or Separated
Demographics Similar to Salvadorans by Divorced or Separated
In terms of divorced or separated, the demographic groups most similar to Salvadorans are Maltese (11.6%, a difference of 0.020%), Immigrants from Croatia (11.6%, a difference of 0.050%), Immigrants from El Salvador (11.7%, a difference of 0.12%), Immigrants from Kazakhstan (11.7%, a difference of 0.16%), and Immigrants from Guyana (11.6%, a difference of 0.19%).
| Demographics | Rating | Rank | Divorced or Separated |
| Latvians | 98.7 /100 | #97 | Exceptional 11.6% |
| Immigrants | Jordan | 98.6 /100 | #98 | Exceptional 11.6% |
| Immigrants | Sweden | 98.6 /100 | #99 | Exceptional 11.6% |
| Immigrants | Northern Europe | 98.6 /100 | #100 | Exceptional 11.6% |
| Immigrants | Guyana | 98.5 /100 | #101 | Exceptional 11.6% |
| Immigrants | Croatia | 98.3 /100 | #102 | Exceptional 11.6% |
| Maltese | 98.2 /100 | #103 | Exceptional 11.6% |
| Salvadorans | 98.2 /100 | #104 | Exceptional 11.6% |
| Immigrants | El Salvador | 97.9 /100 | #105 | Exceptional 11.7% |
| Immigrants | Kazakhstan | 97.8 /100 | #106 | Exceptional 11.7% |
| Native Hawaiians | 97.2 /100 | #107 | Exceptional 11.7% |
| Greeks | 96.9 /100 | #108 | Exceptional 11.7% |
| Immigrants | South Africa | 96.9 /100 | #109 | Exceptional 11.7% |
| Immigrants | Czechoslovakia | 96.9 /100 | #110 | Exceptional 11.7% |
| Immigrants | Spain | 96.8 /100 | #111 | Exceptional 11.7% |
Demographics Similar to Immigrants from Eritrea by Divorced or Separated
In terms of divorced or separated, the demographic groups most similar to Immigrants from Eritrea are Immigrants from Thailand (12.1%, a difference of 0.020%), Immigrants from England (12.1%, a difference of 0.020%), Norwegian (12.1%, a difference of 0.050%), Immigrants from Burma/Myanmar (12.1%, a difference of 0.060%), and Immigrants from Africa (12.1%, a difference of 0.060%).
| Demographics | Rating | Rank | Divorced or Separated |
| Belizeans | 37.7 /100 | #187 | Fair 12.1% |
| Immigrants | Belize | 37.6 /100 | #188 | Fair 12.1% |
| Sierra Leoneans | 35.5 /100 | #189 | Fair 12.1% |
| Moroccans | 34.8 /100 | #190 | Fair 12.1% |
| Swedes | 34.4 /100 | #191 | Fair 12.1% |
| Norwegians | 33.2 /100 | #192 | Fair 12.1% |
| Immigrants | Thailand | 32.5 /100 | #193 | Fair 12.1% |
| Immigrants | Eritrea | 31.9 /100 | #194 | Fair 12.1% |
| Immigrants | England | 31.4 /100 | #195 | Fair 12.1% |
| Immigrants | Burma/Myanmar | 30.4 /100 | #196 | Fair 12.1% |
| Immigrants | Africa | 30.3 /100 | #197 | Fair 12.1% |
| Nigerians | 30.1 /100 | #198 | Fair 12.1% |
| Central Americans | 29.4 /100 | #199 | Fair 12.1% |
| South Americans | 28.6 /100 | #200 | Fair 12.2% |
| Guatemalans | 26.9 /100 | #201 | Fair 12.2% |