Salvadoran vs Immigrants from England 3 or more Vehicles in Household
COMPARE
Salvadoran
Immigrants from England
3 or more Vehicles in Household
3 or more Vehicles in Household Comparison
Salvadorans
Immigrants from England
21.8%
3 OR MORE VEHICLES IN HOUSEHOLD
99.8/ 100
METRIC RATING
73rd/ 347
METRIC RANK
20.7%
3 OR MORE VEHICLES IN HOUSEHOLD
96.2/ 100
METRIC RATING
113th/ 347
METRIC RANK
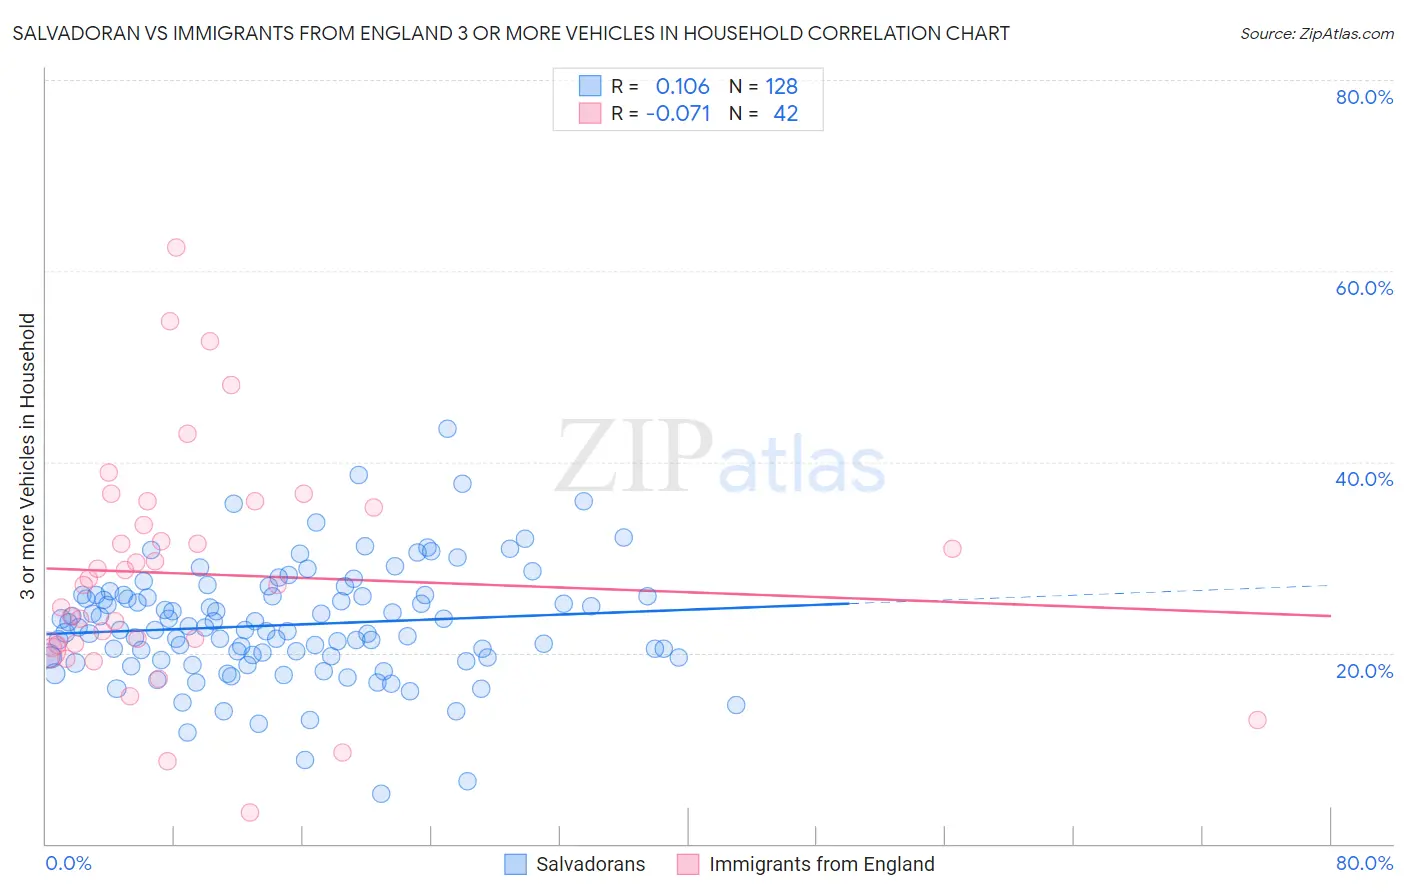
Salvadoran vs Immigrants from England 3 or more Vehicles in Household Correlation Chart
The statistical analysis conducted on geographies consisting of 398,656,904 people shows a poor positive correlation between the proportion of Salvadorans and percentage of households with 3 or more vehicles available in the United States with a correlation coefficient (R) of 0.106 and weighted average of 21.8%. Similarly, the statistical analysis conducted on geographies consisting of 391,649,997 people shows a slight negative correlation between the proportion of Immigrants from England and percentage of households with 3 or more vehicles available in the United States with a correlation coefficient (R) of -0.071 and weighted average of 20.7%, a difference of 5.4%.
3 or more Vehicles in Household Correlation Summary
| Measurement | Salvadoran | Immigrants from England |
| Minimum | 5.3% | 3.3% |
| Maximum | 43.4% | 62.4% |
| Range | 38.2% | 59.1% |
| Mean | 22.9% | 28.2% |
| Median | 22.4% | 27.4% |
| Interquartile 25% (IQ1) | 19.6% | 20.8% |
| Interquartile 75% (IQ3) | 26.0% | 35.2% |
| Interquartile Range (IQR) | 6.4% | 14.4% |
| Standard Deviation (Sample) | 6.0% | 12.1% |
| Standard Deviation (Population) | 6.0% | 12.0% |
Similar Demographics by 3 or more Vehicles in Household
Demographics Similar to Salvadorans by 3 or more Vehicles in Household
In terms of 3 or more vehicles in household, the demographic groups most similar to Salvadorans are Immigrants from Oceania (21.8%, a difference of 0.020%), Portuguese (21.8%, a difference of 0.090%), Japanese (21.8%, a difference of 0.12%), Nonimmigrants (21.8%, a difference of 0.16%), and Irish (21.8%, a difference of 0.24%).
| Demographics | Rating | Rank | 3 or more Vehicles in Household |
| Northern Europeans | 99.9 /100 | #66 | Exceptional 22.0% |
| Alaskan Athabascans | 99.9 /100 | #67 | Exceptional 21.9% |
| British | 99.9 /100 | #68 | Exceptional 21.9% |
| Creek | 99.9 /100 | #69 | Exceptional 21.9% |
| Bangladeshis | 99.8 /100 | #70 | Exceptional 21.9% |
| Potawatomi | 99.8 /100 | #71 | Exceptional 21.9% |
| Portuguese | 99.8 /100 | #72 | Exceptional 21.8% |
| Salvadorans | 99.8 /100 | #73 | Exceptional 21.8% |
| Immigrants | Oceania | 99.8 /100 | #74 | Exceptional 21.8% |
| Japanese | 99.8 /100 | #75 | Exceptional 21.8% |
| Immigrants | Nonimmigrants | 99.8 /100 | #76 | Exceptional 21.8% |
| Irish | 99.8 /100 | #77 | Exceptional 21.8% |
| Czechoslovakians | 99.8 /100 | #78 | Exceptional 21.7% |
| Assyrians/Chaldeans/Syriacs | 99.8 /100 | #79 | Exceptional 21.7% |
| Afghans | 99.7 /100 | #80 | Exceptional 21.7% |
Demographics Similar to Immigrants from England by 3 or more Vehicles in Household
In terms of 3 or more vehicles in household, the demographic groups most similar to Immigrants from England are Nicaraguan (20.7%, a difference of 0.010%), Burmese (20.6%, a difference of 0.18%), Immigrants from Micronesia (20.7%, a difference of 0.30%), Asian (20.8%, a difference of 0.33%), and Filipino (20.8%, a difference of 0.47%).
| Demographics | Rating | Rank | 3 or more Vehicles in Household |
| Bolivians | 97.4 /100 | #106 | Exceptional 20.8% |
| Immigrants | Germany | 97.4 /100 | #107 | Exceptional 20.8% |
| Immigrants | Scotland | 97.1 /100 | #108 | Exceptional 20.8% |
| Filipinos | 97.0 /100 | #109 | Exceptional 20.8% |
| Asians | 96.8 /100 | #110 | Exceptional 20.8% |
| Immigrants | Micronesia | 96.7 /100 | #111 | Exceptional 20.7% |
| Nicaraguans | 96.2 /100 | #112 | Exceptional 20.7% |
| Immigrants | England | 96.2 /100 | #113 | Exceptional 20.7% |
| Burmese | 95.8 /100 | #114 | Exceptional 20.6% |
| French Canadians | 95.0 /100 | #115 | Exceptional 20.6% |
| Italians | 94.9 /100 | #116 | Exceptional 20.6% |
| Croatians | 94.9 /100 | #117 | Exceptional 20.6% |
| Costa Ricans | 94.6 /100 | #118 | Exceptional 20.6% |
| Immigrants | Latin America | 94.5 /100 | #119 | Exceptional 20.5% |
| Maltese | 93.9 /100 | #120 | Exceptional 20.5% |