Salvadoran vs Tsimshian 3 or more Vehicles in Household
COMPARE
Salvadoran
Tsimshian
3 or more Vehicles in Household
3 or more Vehicles in Household Comparison
Salvadorans
Tsimshian
21.8%
3 OR MORE VEHICLES IN HOUSEHOLD
99.8/ 100
METRIC RATING
73rd/ 347
METRIC RANK
19.1%
3 OR MORE VEHICLES IN HOUSEHOLD
24.4/ 100
METRIC RATING
193rd/ 347
METRIC RANK
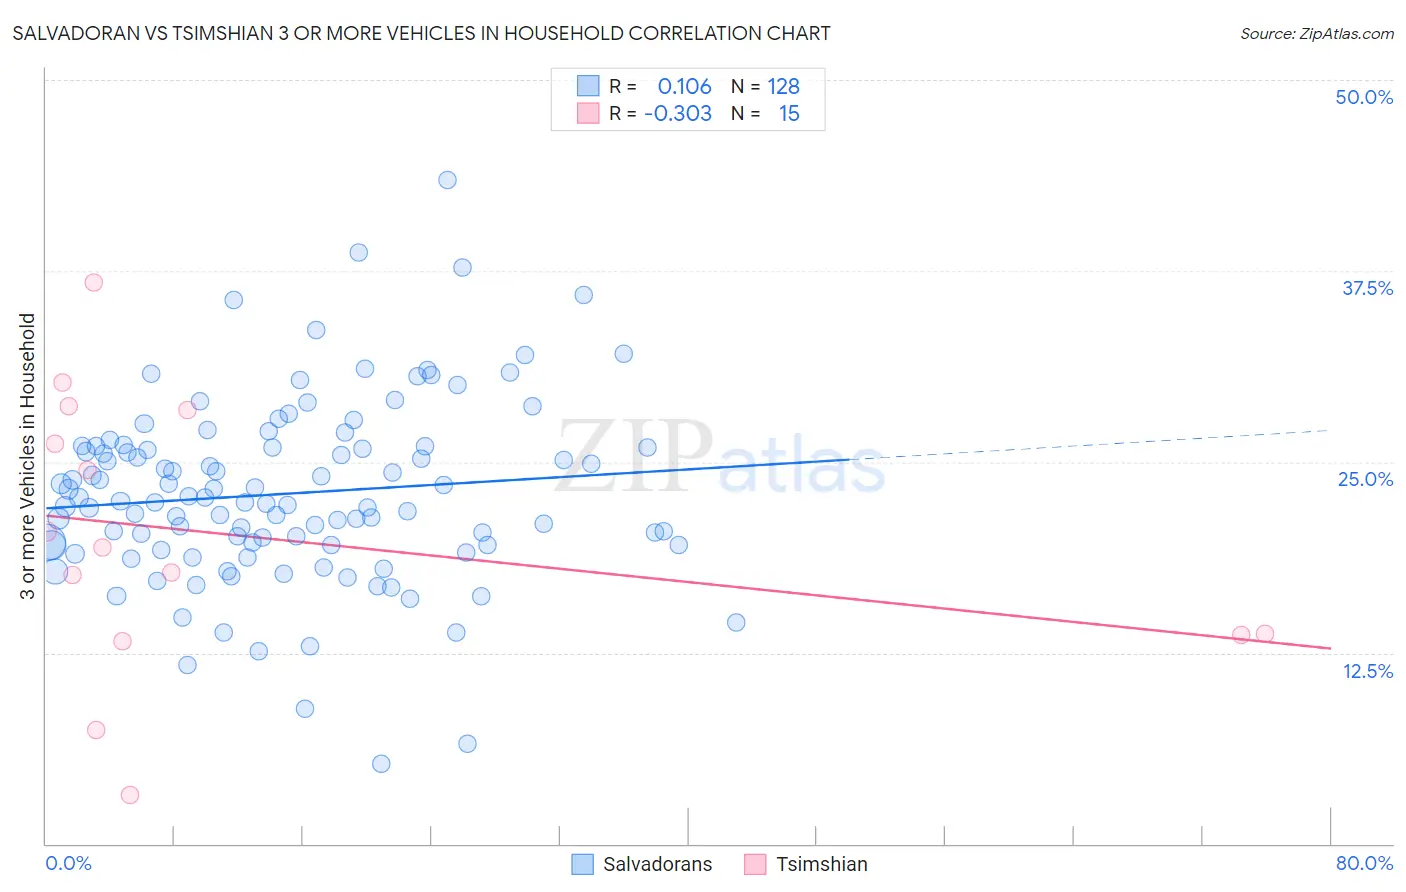
Salvadoran vs Tsimshian 3 or more Vehicles in Household Correlation Chart
The statistical analysis conducted on geographies consisting of 398,656,904 people shows a poor positive correlation between the proportion of Salvadorans and percentage of households with 3 or more vehicles available in the United States with a correlation coefficient (R) of 0.106 and weighted average of 21.8%. Similarly, the statistical analysis conducted on geographies consisting of 15,626,544 people shows a mild negative correlation between the proportion of Tsimshian and percentage of households with 3 or more vehicles available in the United States with a correlation coefficient (R) of -0.303 and weighted average of 19.1%, a difference of 14.3%.
3 or more Vehicles in Household Correlation Summary
| Measurement | Salvadoran | Tsimshian |
| Minimum | 5.3% | 3.2% |
| Maximum | 43.4% | 36.7% |
| Range | 38.2% | 33.5% |
| Mean | 22.9% | 20.1% |
| Median | 22.4% | 19.4% |
| Interquartile 25% (IQ1) | 19.6% | 13.6% |
| Interquartile 75% (IQ3) | 26.0% | 28.4% |
| Interquartile Range (IQR) | 6.4% | 14.8% |
| Standard Deviation (Sample) | 6.0% | 9.1% |
| Standard Deviation (Population) | 6.0% | 8.8% |
Similar Demographics by 3 or more Vehicles in Household
Demographics Similar to Salvadorans by 3 or more Vehicles in Household
In terms of 3 or more vehicles in household, the demographic groups most similar to Salvadorans are Immigrants from Oceania (21.8%, a difference of 0.020%), Portuguese (21.8%, a difference of 0.090%), Japanese (21.8%, a difference of 0.12%), Nonimmigrants (21.8%, a difference of 0.16%), and Irish (21.8%, a difference of 0.24%).
| Demographics | Rating | Rank | 3 or more Vehicles in Household |
| Northern Europeans | 99.9 /100 | #66 | Exceptional 22.0% |
| Alaskan Athabascans | 99.9 /100 | #67 | Exceptional 21.9% |
| British | 99.9 /100 | #68 | Exceptional 21.9% |
| Creek | 99.9 /100 | #69 | Exceptional 21.9% |
| Bangladeshis | 99.8 /100 | #70 | Exceptional 21.9% |
| Potawatomi | 99.8 /100 | #71 | Exceptional 21.9% |
| Portuguese | 99.8 /100 | #72 | Exceptional 21.8% |
| Salvadorans | 99.8 /100 | #73 | Exceptional 21.8% |
| Immigrants | Oceania | 99.8 /100 | #74 | Exceptional 21.8% |
| Japanese | 99.8 /100 | #75 | Exceptional 21.8% |
| Immigrants | Nonimmigrants | 99.8 /100 | #76 | Exceptional 21.8% |
| Irish | 99.8 /100 | #77 | Exceptional 21.8% |
| Czechoslovakians | 99.8 /100 | #78 | Exceptional 21.7% |
| Assyrians/Chaldeans/Syriacs | 99.8 /100 | #79 | Exceptional 21.7% |
| Afghans | 99.7 /100 | #80 | Exceptional 21.7% |
Demographics Similar to Tsimshian by 3 or more Vehicles in Household
In terms of 3 or more vehicles in household, the demographic groups most similar to Tsimshian are Kenyan (19.1%, a difference of 0.030%), Serbian (19.1%, a difference of 0.040%), Immigrants from Moldova (19.1%, a difference of 0.080%), South American Indian (19.1%, a difference of 0.10%), and Immigrants from Zimbabwe (19.1%, a difference of 0.11%).
| Demographics | Rating | Rank | 3 or more Vehicles in Household |
| Immigrants | Sweden | 29.0 /100 | #186 | Fair 19.2% |
| Immigrants | Hong Kong | 28.3 /100 | #187 | Fair 19.2% |
| Immigrants | Kuwait | 26.1 /100 | #188 | Fair 19.1% |
| Indians (Asian) | 26.0 /100 | #189 | Fair 19.1% |
| Immigrants | Zimbabwe | 25.5 /100 | #190 | Fair 19.1% |
| South American Indians | 25.4 /100 | #191 | Fair 19.1% |
| Kenyans | 24.7 /100 | #192 | Fair 19.1% |
| Tsimshian | 24.4 /100 | #193 | Fair 19.1% |
| Serbians | 24.0 /100 | #194 | Fair 19.1% |
| Immigrants | Moldova | 23.6 /100 | #195 | Fair 19.1% |
| Central American Indians | 22.2 /100 | #196 | Fair 19.0% |
| Immigrants | Japan | 22.0 /100 | #197 | Fair 19.0% |
| Egyptians | 19.5 /100 | #198 | Poor 19.0% |
| Immigrants | Norway | 19.0 /100 | #199 | Poor 19.0% |
| Argentineans | 18.2 /100 | #200 | Poor 18.9% |