Salvadoran vs Immigrants from Eritrea Female Poverty
COMPARE
Salvadoran
Immigrants from Eritrea
Female Poverty
Female Poverty Comparison
Salvadorans
Immigrants from Eritrea
15.3%
FEMALE POVERTY
0.3/ 100
METRIC RATING
249th/ 347
METRIC RANK
14.6%
FEMALE POVERTY
2.4/ 100
METRIC RATING
226th/ 347
METRIC RANK
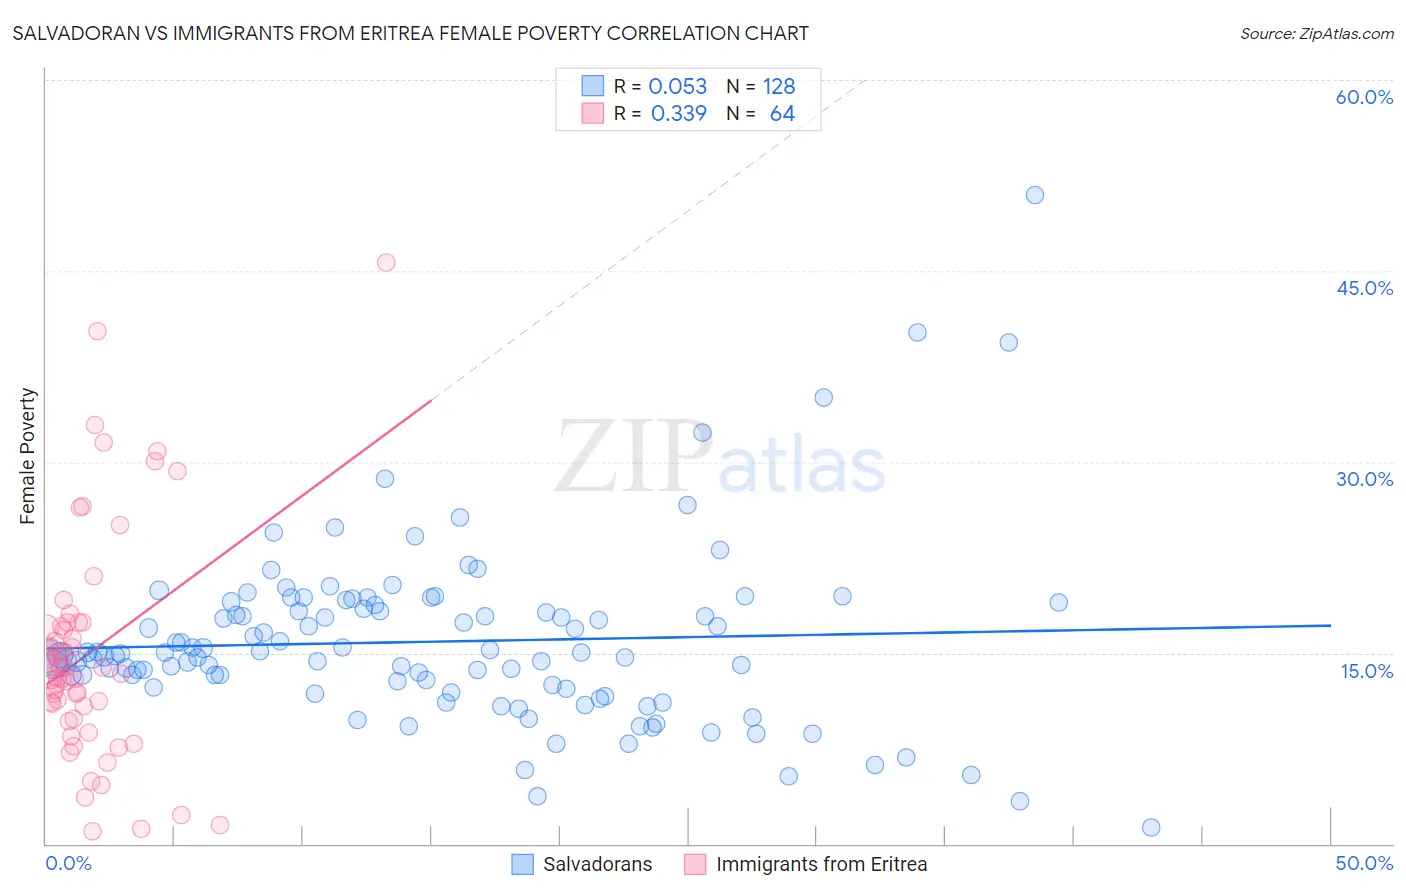
Salvadoran vs Immigrants from Eritrea Female Poverty Correlation Chart
The statistical analysis conducted on geographies consisting of 398,655,447 people shows a slight positive correlation between the proportion of Salvadorans and poverty level among females in the United States with a correlation coefficient (R) of 0.053 and weighted average of 15.3%. Similarly, the statistical analysis conducted on geographies consisting of 104,846,826 people shows a mild positive correlation between the proportion of Immigrants from Eritrea and poverty level among females in the United States with a correlation coefficient (R) of 0.339 and weighted average of 14.6%, a difference of 4.7%.
Female Poverty Correlation Summary
| Measurement | Salvadoran | Immigrants from Eritrea |
| Minimum | 1.3% | 1.0% |
| Maximum | 50.9% | 45.6% |
| Range | 49.7% | 44.6% |
| Mean | 15.9% | 15.0% |
| Median | 14.9% | 13.6% |
| Interquartile 25% (IQ1) | 12.3% | 10.3% |
| Interquartile 75% (IQ3) | 18.6% | 17.2% |
| Interquartile Range (IQR) | 6.3% | 6.9% |
| Standard Deviation (Sample) | 6.9% | 8.9% |
| Standard Deviation (Population) | 6.9% | 8.8% |
Similar Demographics by Female Poverty
Demographics Similar to Salvadorans by Female Poverty
In terms of female poverty, the demographic groups most similar to Salvadorans are Immigrants from Western Africa (15.3%, a difference of 0.040%), Potawatomi (15.3%, a difference of 0.14%), Immigrants from Ghana (15.3%, a difference of 0.14%), Cuban (15.3%, a difference of 0.15%), and Spanish American Indian (15.3%, a difference of 0.20%).
| Demographics | Rating | Rank | Female Poverty |
| Nepalese | 0.4 /100 | #242 | Tragic 15.2% |
| Nicaraguans | 0.3 /100 | #243 | Tragic 15.3% |
| Ecuadorians | 0.3 /100 | #244 | Tragic 15.3% |
| Spanish American Indians | 0.3 /100 | #245 | Tragic 15.3% |
| Cubans | 0.3 /100 | #246 | Tragic 15.3% |
| Potawatomi | 0.3 /100 | #247 | Tragic 15.3% |
| Immigrants | Ghana | 0.3 /100 | #248 | Tragic 15.3% |
| Salvadorans | 0.3 /100 | #249 | Tragic 15.3% |
| Immigrants | Western Africa | 0.3 /100 | #250 | Tragic 15.3% |
| Immigrants | Trinidad and Tobago | 0.3 /100 | #251 | Tragic 15.4% |
| Immigrants | Burma/Myanmar | 0.3 /100 | #252 | Tragic 15.4% |
| Liberians | 0.2 /100 | #253 | Tragic 15.4% |
| Trinidadians and Tobagonians | 0.2 /100 | #254 | Tragic 15.4% |
| Ottawa | 0.2 /100 | #255 | Tragic 15.5% |
| Jamaicans | 0.2 /100 | #256 | Tragic 15.5% |
Demographics Similar to Immigrants from Eritrea by Female Poverty
In terms of female poverty, the demographic groups most similar to Immigrants from Eritrea are Immigrants from Nigeria (14.7%, a difference of 0.31%), American (14.6%, a difference of 0.33%), Immigrants from Micronesia (14.6%, a difference of 0.33%), German Russian (14.7%, a difference of 0.45%), and Ghanaian (14.7%, a difference of 0.52%).
| Demographics | Rating | Rank | Female Poverty |
| Japanese | 4.1 /100 | #219 | Tragic 14.5% |
| Alsatians | 4.0 /100 | #220 | Tragic 14.5% |
| Immigrants | Cambodia | 3.7 /100 | #221 | Tragic 14.5% |
| Immigrants | Nonimmigrants | 3.7 /100 | #222 | Tragic 14.5% |
| Immigrants | Africa | 3.3 /100 | #223 | Tragic 14.5% |
| Americans | 2.8 /100 | #224 | Tragic 14.6% |
| Immigrants | Micronesia | 2.8 /100 | #225 | Tragic 14.6% |
| Immigrants | Eritrea | 2.4 /100 | #226 | Tragic 14.6% |
| Immigrants | Nigeria | 2.1 /100 | #227 | Tragic 14.7% |
| German Russians | 2.0 /100 | #228 | Tragic 14.7% |
| Ghanaians | 1.9 /100 | #229 | Tragic 14.7% |
| Alaska Natives | 1.8 /100 | #230 | Tragic 14.7% |
| Nigerians | 1.7 /100 | #231 | Tragic 14.8% |
| Osage | 1.5 /100 | #232 | Tragic 14.8% |
| Immigrants | Saudi Arabia | 1.4 /100 | #233 | Tragic 14.8% |