Immigrants from Cameroon vs Immigrants from Eritrea 3 or more Vehicles in Household
COMPARE
Immigrants from Cameroon
Immigrants from Eritrea
3 or more Vehicles in Household
3 or more Vehicles in Household Comparison
Immigrants from Cameroon
Immigrants from Eritrea
19.7%
3 OR MORE VEHICLES IN HOUSEHOLD
60.9/ 100
METRIC RATING
166th/ 347
METRIC RANK
17.8%
3 OR MORE VEHICLES IN HOUSEHOLD
1.1/ 100
METRIC RATING
257th/ 347
METRIC RANK
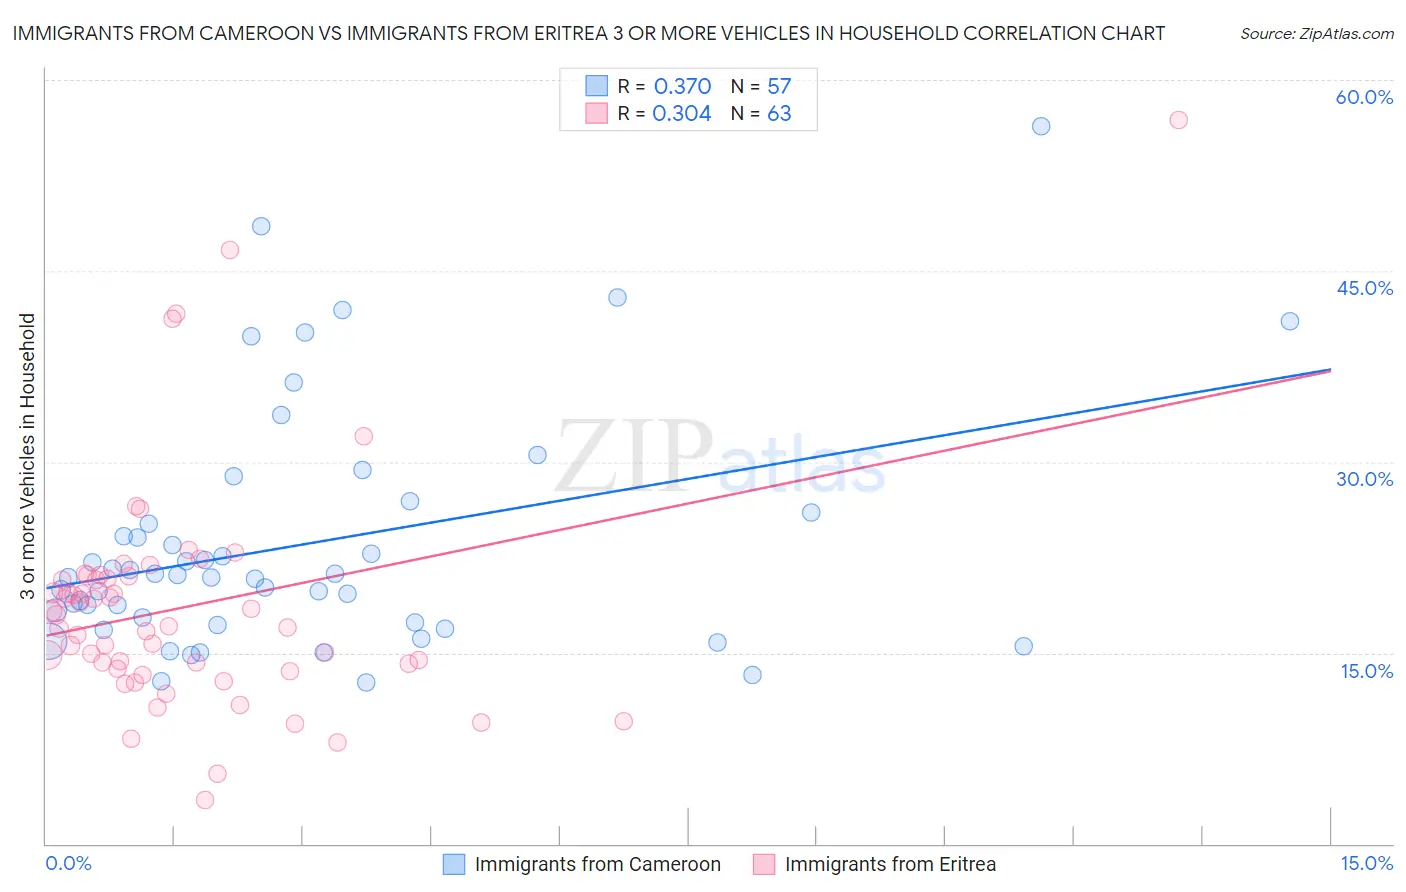
Immigrants from Cameroon vs Immigrants from Eritrea 3 or more Vehicles in Household Correlation Chart
The statistical analysis conducted on geographies consisting of 130,731,455 people shows a mild positive correlation between the proportion of Immigrants from Cameroon and percentage of households with 3 or more vehicles available in the United States with a correlation coefficient (R) of 0.370 and weighted average of 19.7%. Similarly, the statistical analysis conducted on geographies consisting of 104,844,595 people shows a mild positive correlation between the proportion of Immigrants from Eritrea and percentage of households with 3 or more vehicles available in the United States with a correlation coefficient (R) of 0.304 and weighted average of 17.8%, a difference of 10.2%.
3 or more Vehicles in Household Correlation Summary
| Measurement | Immigrants from Cameroon | Immigrants from Eritrea |
| Minimum | 12.6% | 3.4% |
| Maximum | 56.3% | 56.8% |
| Range | 43.7% | 53.4% |
| Mean | 23.5% | 18.6% |
| Median | 20.9% | 17.0% |
| Interquartile 25% (IQ1) | 17.3% | 13.8% |
| Interquartile 75% (IQ3) | 25.6% | 21.0% |
| Interquartile Range (IQR) | 8.3% | 7.2% |
| Standard Deviation (Sample) | 9.4% | 9.1% |
| Standard Deviation (Population) | 9.3% | 9.0% |
Similar Demographics by 3 or more Vehicles in Household
Demographics Similar to Immigrants from Cameroon by 3 or more Vehicles in Household
In terms of 3 or more vehicles in household, the demographic groups most similar to Immigrants from Cameroon are Immigrants from Costa Rica (19.7%, a difference of 0.080%), Yugoslavian (19.7%, a difference of 0.16%), Ukrainian (19.6%, a difference of 0.16%), Chilean (19.7%, a difference of 0.17%), and Peruvian (19.6%, a difference of 0.17%).
| Demographics | Rating | Rank | 3 or more Vehicles in Household |
| Immigrants | Pakistan | 68.2 /100 | #159 | Good 19.8% |
| Immigrants | Lebanon | 67.6 /100 | #160 | Good 19.8% |
| Immigrants | Guatemala | 65.6 /100 | #161 | Good 19.7% |
| Estonians | 63.2 /100 | #162 | Good 19.7% |
| Chileans | 63.0 /100 | #163 | Good 19.7% |
| Yugoslavians | 62.9 /100 | #164 | Good 19.7% |
| Immigrants | Costa Rica | 61.9 /100 | #165 | Good 19.7% |
| Immigrants | Cameroon | 60.9 /100 | #166 | Good 19.7% |
| Ukrainians | 58.9 /100 | #167 | Average 19.6% |
| Peruvians | 58.8 /100 | #168 | Average 19.6% |
| Immigrants | Denmark | 57.6 /100 | #169 | Average 19.6% |
| Iraqis | 56.0 /100 | #170 | Average 19.6% |
| Immigrants | Western Europe | 53.2 /100 | #171 | Average 19.5% |
| Kiowa | 50.9 /100 | #172 | Average 19.5% |
| Immigrants | Northern Europe | 50.2 /100 | #173 | Average 19.5% |
Demographics Similar to Immigrants from Eritrea by 3 or more Vehicles in Household
In terms of 3 or more vehicles in household, the demographic groups most similar to Immigrants from Eritrea are Sudanese (17.8%, a difference of 0.0%), Subsaharan African (17.9%, a difference of 0.050%), Immigrants from Turkey (17.9%, a difference of 0.20%), Uruguayan (17.8%, a difference of 0.22%), and Immigrants from Ethiopia (17.9%, a difference of 0.23%).
| Demographics | Rating | Rank | 3 or more Vehicles in Household |
| Venezuelans | 1.7 /100 | #250 | Tragic 18.0% |
| Alsatians | 1.5 /100 | #251 | Tragic 18.0% |
| Immigrants | Southern Europe | 1.4 /100 | #252 | Tragic 17.9% |
| Immigrants | Ethiopia | 1.3 /100 | #253 | Tragic 17.9% |
| Ethiopians | 1.2 /100 | #254 | Tragic 17.9% |
| Immigrants | Turkey | 1.2 /100 | #255 | Tragic 17.9% |
| Sub-Saharan Africans | 1.1 /100 | #256 | Tragic 17.9% |
| Immigrants | Eritrea | 1.1 /100 | #257 | Tragic 17.8% |
| Sudanese | 1.1 /100 | #258 | Tragic 17.8% |
| Uruguayans | 1.0 /100 | #259 | Tragic 17.8% |
| Ugandans | 0.9 /100 | #260 | Tragic 17.8% |
| Immigrants | Northern Africa | 0.9 /100 | #261 | Tragic 17.8% |
| Colombians | 0.9 /100 | #262 | Tragic 17.8% |
| Bermudans | 0.9 /100 | #263 | Tragic 17.8% |
| Cambodians | 0.9 /100 | #264 | Tragic 17.8% |