Salvadoran vs Immigrants from Eritrea Unemployment Among Ages 20 to 24 years
COMPARE
Salvadoran
Immigrants from Eritrea
Unemployment Among Ages 20 to 24 years
Unemployment Among Ages 20 to 24 years Comparison
Salvadorans
Immigrants from Eritrea
10.7%
UNEMPLOYMENT AMONG AGES 20 TO 24 YEARS
2.4/ 100
METRIC RATING
239th/ 347
METRIC RANK
9.5%
UNEMPLOYMENT AMONG AGES 20 TO 24 YEARS
100.0/ 100
METRIC RATING
25th/ 347
METRIC RANK
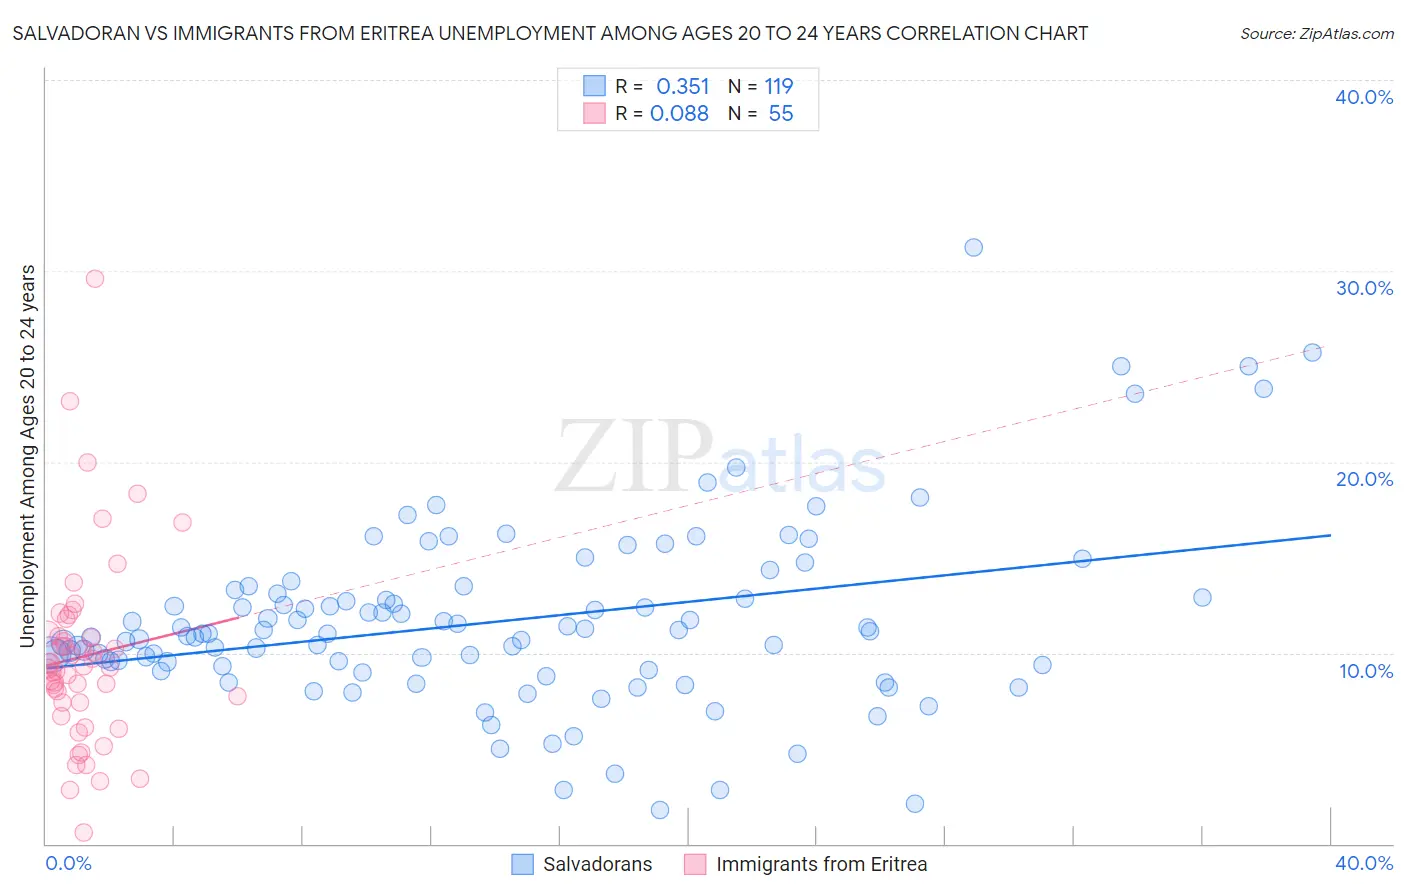
Salvadoran vs Immigrants from Eritrea Unemployment Among Ages 20 to 24 years Correlation Chart
The statistical analysis conducted on geographies consisting of 387,862,775 people shows a mild positive correlation between the proportion of Salvadorans and unemployment rate among population between the ages 20 and 24 in the United States with a correlation coefficient (R) of 0.351 and weighted average of 10.7%. Similarly, the statistical analysis conducted on geographies consisting of 104,445,280 people shows a slight positive correlation between the proportion of Immigrants from Eritrea and unemployment rate among population between the ages 20 and 24 in the United States with a correlation coefficient (R) of 0.088 and weighted average of 9.5%, a difference of 12.6%.
Unemployment Among Ages 20 to 24 years Correlation Summary
| Measurement | Salvadoran | Immigrants from Eritrea |
| Minimum | 1.8% | 0.60% |
| Maximum | 31.2% | 29.6% |
| Range | 29.4% | 29.0% |
| Mean | 11.7% | 9.8% |
| Median | 11.0% | 9.2% |
| Interquartile 25% (IQ1) | 9.3% | 7.4% |
| Interquartile 75% (IQ3) | 13.1% | 11.0% |
| Interquartile Range (IQR) | 3.8% | 3.6% |
| Standard Deviation (Sample) | 4.8% | 5.0% |
| Standard Deviation (Population) | 4.7% | 5.0% |
Similar Demographics by Unemployment Among Ages 20 to 24 years
Demographics Similar to Salvadorans by Unemployment Among Ages 20 to 24 years
In terms of unemployment among ages 20 to 24 years, the demographic groups most similar to Salvadorans are Immigrants from Pakistan (10.6%, a difference of 0.060%), Immigrants (10.6%, a difference of 0.080%), Immigrants from Central America (10.7%, a difference of 0.19%), Mexican (10.6%, a difference of 0.25%), and Immigrants from Ukraine (10.6%, a difference of 0.29%).
| Demographics | Rating | Rank | Unemployment Among Ages 20 to 24 years |
| Israelis | 3.7 /100 | #232 | Tragic 10.6% |
| Choctaw | 3.6 /100 | #233 | Tragic 10.6% |
| Immigrants | Africa | 3.5 /100 | #234 | Tragic 10.6% |
| Immigrants | Ukraine | 3.3 /100 | #235 | Tragic 10.6% |
| Mexicans | 3.2 /100 | #236 | Tragic 10.6% |
| Immigrants | Immigrants | 2.7 /100 | #237 | Tragic 10.6% |
| Immigrants | Pakistan | 2.6 /100 | #238 | Tragic 10.6% |
| Salvadorans | 2.4 /100 | #239 | Tragic 10.7% |
| Immigrants | Central America | 2.0 /100 | #240 | Tragic 10.7% |
| Immigrants | El Salvador | 1.7 /100 | #241 | Tragic 10.7% |
| Moroccans | 1.4 /100 | #242 | Tragic 10.7% |
| Immigrants | Belarus | 1.3 /100 | #243 | Tragic 10.7% |
| Immigrants | Mexico | 1.2 /100 | #244 | Tragic 10.7% |
| Hispanics or Latinos | 1.0 /100 | #245 | Tragic 10.7% |
| Immigrants | Iran | 0.9 /100 | #246 | Tragic 10.8% |
Demographics Similar to Immigrants from Eritrea by Unemployment Among Ages 20 to 24 years
In terms of unemployment among ages 20 to 24 years, the demographic groups most similar to Immigrants from Eritrea are Swedish (9.5%, a difference of 0.0%), Taiwanese (9.4%, a difference of 0.25%), Tongan (9.4%, a difference of 0.56%), Immigrants from Nepal (9.4%, a difference of 0.56%), and Immigrants from Zimbabwe (9.5%, a difference of 0.61%).
| Demographics | Rating | Rank | Unemployment Among Ages 20 to 24 years |
| Chinese | 100.0 /100 | #18 | Exceptional 9.4% |
| Hmong | 100.0 /100 | #19 | Exceptional 9.4% |
| Osage | 100.0 /100 | #20 | Exceptional 9.4% |
| Immigrants | Bosnia and Herzegovina | 100.0 /100 | #21 | Exceptional 9.4% |
| Tongans | 100.0 /100 | #22 | Exceptional 9.4% |
| Immigrants | Nepal | 100.0 /100 | #23 | Exceptional 9.4% |
| Taiwanese | 100.0 /100 | #24 | Exceptional 9.4% |
| Immigrants | Eritrea | 100.0 /100 | #25 | Exceptional 9.5% |
| Swedes | 100.0 /100 | #26 | Exceptional 9.5% |
| Immigrants | Zimbabwe | 100.0 /100 | #27 | Exceptional 9.5% |
| Immigrants | Afghanistan | 100.0 /100 | #28 | Exceptional 9.5% |
| Immigrants | North Macedonia | 100.0 /100 | #29 | Exceptional 9.5% |
| Scandinavians | 100.0 /100 | #30 | Exceptional 9.5% |
| Immigrants | Eastern Africa | 100.0 /100 | #31 | Exceptional 9.5% |
| Cambodians | 100.0 /100 | #32 | Exceptional 9.5% |