Immigrants from Guyana vs Immigrants from Korea 3 or more Vehicles in Household
COMPARE
Immigrants from Guyana
Immigrants from Korea
3 or more Vehicles in Household
3 or more Vehicles in Household Comparison
Immigrants from Guyana
Immigrants from Korea
11.2%
3 OR MORE VEHICLES IN HOUSEHOLD
0.0/ 100
METRIC RATING
343rd/ 347
METRIC RANK
20.5%
3 OR MORE VEHICLES IN HOUSEHOLD
93.7/ 100
METRIC RATING
123rd/ 347
METRIC RANK
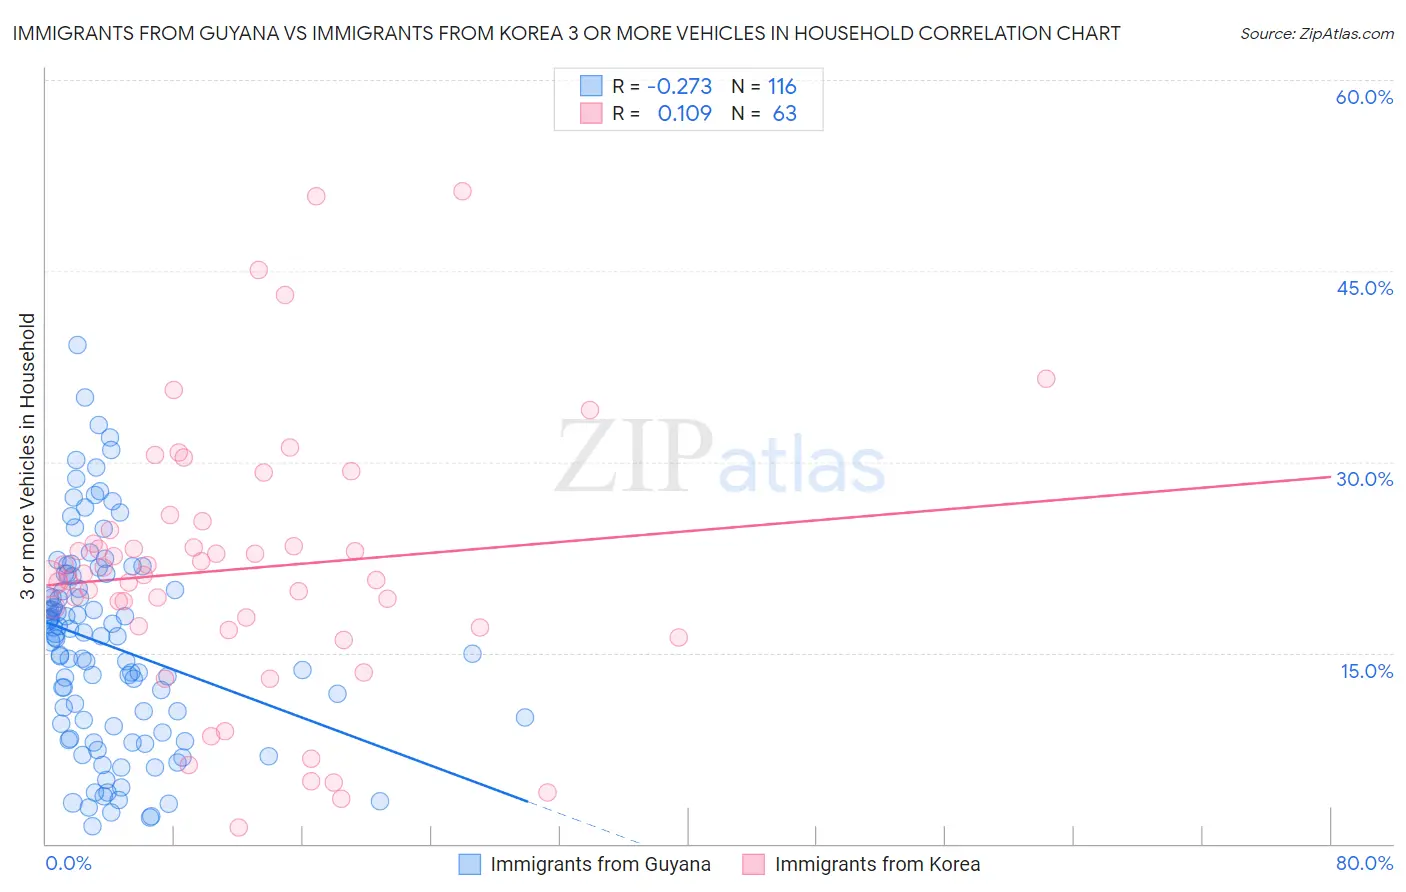
Immigrants from Guyana vs Immigrants from Korea 3 or more Vehicles in Household Correlation Chart
The statistical analysis conducted on geographies consisting of 183,650,953 people shows a weak negative correlation between the proportion of Immigrants from Guyana and percentage of households with 3 or more vehicles available in the United States with a correlation coefficient (R) of -0.273 and weighted average of 11.2%. Similarly, the statistical analysis conducted on geographies consisting of 415,786,030 people shows a poor positive correlation between the proportion of Immigrants from Korea and percentage of households with 3 or more vehicles available in the United States with a correlation coefficient (R) of 0.109 and weighted average of 20.5%, a difference of 82.3%.
3 or more Vehicles in Household Correlation Summary
| Measurement | Immigrants from Guyana | Immigrants from Korea |
| Minimum | 1.4% | 1.2% |
| Maximum | 39.2% | 51.2% |
| Range | 37.8% | 50.0% |
| Mean | 15.5% | 21.6% |
| Median | 16.2% | 21.1% |
| Interquartile 25% (IQ1) | 9.0% | 17.0% |
| Interquartile 75% (IQ3) | 20.5% | 24.6% |
| Interquartile Range (IQR) | 11.5% | 7.6% |
| Standard Deviation (Sample) | 8.1% | 10.3% |
| Standard Deviation (Population) | 8.1% | 10.3% |
Similar Demographics by 3 or more Vehicles in Household
Demographics Similar to Immigrants from Guyana by 3 or more Vehicles in Household
In terms of 3 or more vehicles in household, the demographic groups most similar to Immigrants from Guyana are Dominican (11.2%, a difference of 0.15%), British West Indian (11.4%, a difference of 1.8%), Guyanese (11.5%, a difference of 1.9%), Immigrants from Barbados (11.7%, a difference of 4.3%), and Immigrants from Uzbekistan (12.0%, a difference of 6.6%).
| Demographics | Rating | Rank | 3 or more Vehicles in Household |
| Immigrants | Cabo Verde | 0.0 /100 | #333 | Tragic 13.6% |
| Immigrants | Ecuador | 0.0 /100 | #334 | Tragic 13.4% |
| Immigrants | Trinidad and Tobago | 0.0 /100 | #335 | Tragic 13.3% |
| Barbadians | 0.0 /100 | #336 | Tragic 12.6% |
| Immigrants | Bangladesh | 0.0 /100 | #337 | Tragic 12.5% |
| Vietnamese | 0.0 /100 | #338 | Tragic 12.5% |
| Immigrants | Uzbekistan | 0.0 /100 | #339 | Tragic 12.0% |
| Immigrants | Barbados | 0.0 /100 | #340 | Tragic 11.7% |
| Guyanese | 0.0 /100 | #341 | Tragic 11.5% |
| British West Indians | 0.0 /100 | #342 | Tragic 11.4% |
| Immigrants | Guyana | 0.0 /100 | #343 | Tragic 11.2% |
| Dominicans | 0.0 /100 | #344 | Tragic 11.2% |
| Immigrants | Dominican Republic | 0.0 /100 | #345 | Tragic 10.4% |
| Immigrants | St. Vincent and the Grenadines | 0.0 /100 | #346 | Tragic 10.1% |
| Immigrants | Grenada | 0.0 /100 | #347 | Tragic 9.1% |
Demographics Similar to Immigrants from Korea by 3 or more Vehicles in Household
In terms of 3 or more vehicles in household, the demographic groups most similar to Immigrants from Korea are German Russian (20.5%, a difference of 0.010%), Immigrants from Thailand (20.5%, a difference of 0.050%), Maltese (20.5%, a difference of 0.060%), Central American (20.5%, a difference of 0.17%), and Immigrants from Netherlands (20.4%, a difference of 0.20%).
| Demographics | Rating | Rank | 3 or more Vehicles in Household |
| Italians | 94.9 /100 | #116 | Exceptional 20.6% |
| Croatians | 94.9 /100 | #117 | Exceptional 20.6% |
| Costa Ricans | 94.6 /100 | #118 | Exceptional 20.6% |
| Immigrants | Latin America | 94.5 /100 | #119 | Exceptional 20.5% |
| Maltese | 93.9 /100 | #120 | Exceptional 20.5% |
| Immigrants | Thailand | 93.8 /100 | #121 | Exceptional 20.5% |
| German Russians | 93.7 /100 | #122 | Exceptional 20.5% |
| Immigrants | Korea | 93.7 /100 | #123 | Exceptional 20.5% |
| Central Americans | 93.1 /100 | #124 | Exceptional 20.5% |
| Immigrants | Netherlands | 92.9 /100 | #125 | Exceptional 20.4% |
| Slavs | 92.1 /100 | #126 | Exceptional 20.4% |
| Immigrants | Bolivia | 92.0 /100 | #127 | Exceptional 20.4% |
| New Zealanders | 91.3 /100 | #128 | Exceptional 20.4% |
| Zimbabweans | 88.7 /100 | #129 | Excellent 20.3% |
| Greeks | 88.6 /100 | #130 | Excellent 20.3% |