Peruvian vs Immigrants from Korea Householder Income Under 25 years
COMPARE
Peruvian
Immigrants from Korea
Householder Income Under 25 years
Householder Income Under 25 years Comparison
Peruvians
Immigrants from Korea
$56,052
HOUSEHOLDER INCOME UNDER 25 YEARS
100.0/ 100
METRIC RATING
32nd/ 347
METRIC RANK
$55,716
HOUSEHOLDER INCOME UNDER 25 YEARS
100.0/ 100
METRIC RATING
42nd/ 347
METRIC RANK
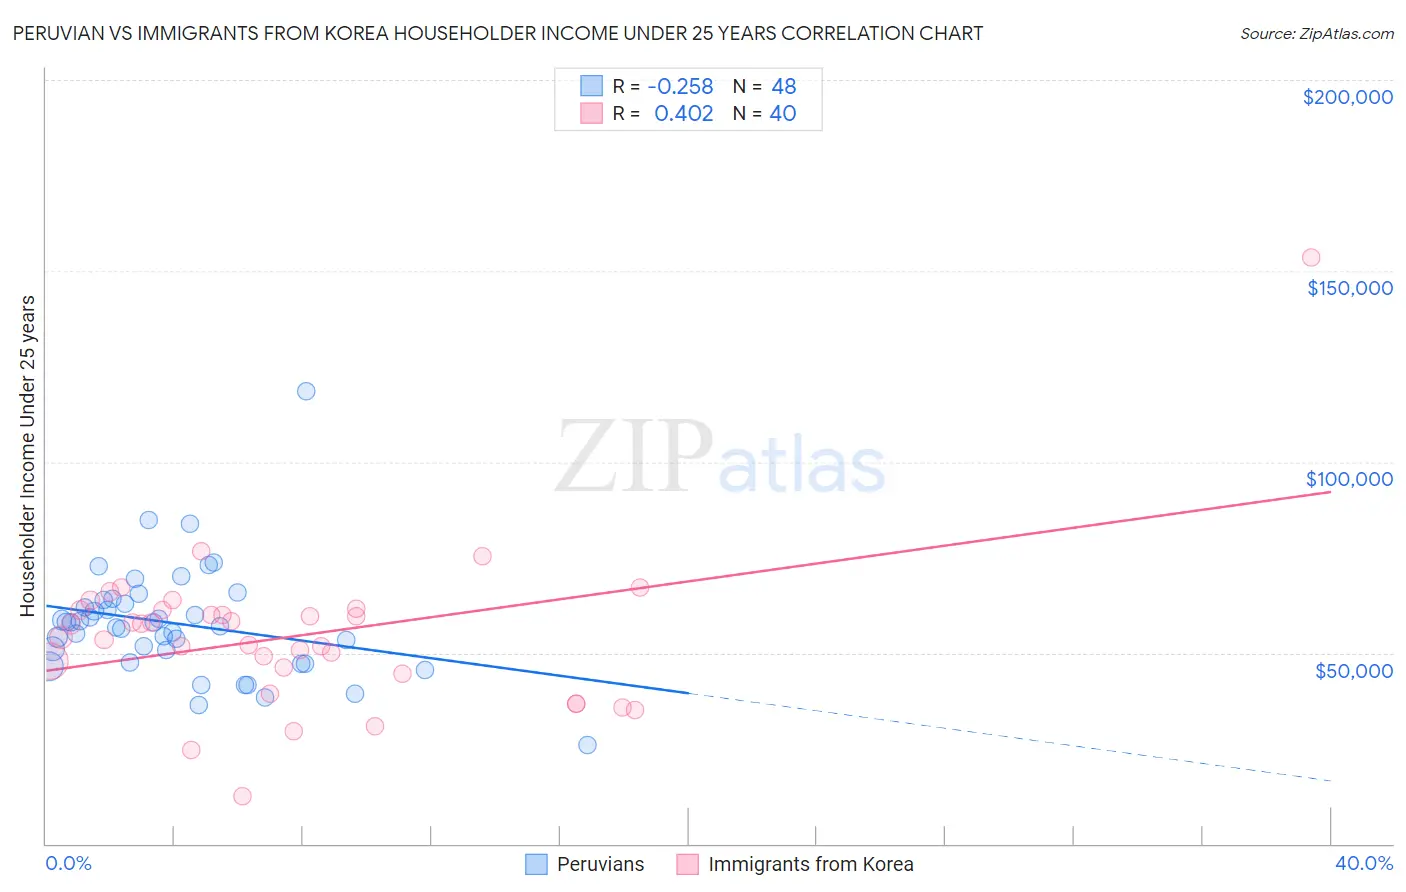
Peruvian vs Immigrants from Korea Householder Income Under 25 years Correlation Chart
The statistical analysis conducted on geographies consisting of 309,109,247 people shows a weak negative correlation between the proportion of Peruvians and household income with householder under the age of 25 in the United States with a correlation coefficient (R) of -0.258 and weighted average of $56,052. Similarly, the statistical analysis conducted on geographies consisting of 348,325,836 people shows a moderate positive correlation between the proportion of Immigrants from Korea and household income with householder under the age of 25 in the United States with a correlation coefficient (R) of 0.402 and weighted average of $55,716, a difference of 0.60%.
Householder Income Under 25 years Correlation Summary
| Measurement | Peruvian | Immigrants from Korea |
| Minimum | $25,923 | $12,383 |
| Maximum | $118,438 | $153,485 |
| Range | $92,515 | $141,102 |
| Mean | $57,665 | $54,433 |
| Median | $57,415 | $55,776 |
| Interquartile 25% (IQ1) | $48,987 | $45,346 |
| Interquartile 75% (IQ3) | $63,410 | $61,192 |
| Interquartile Range (IQR) | $14,423 | $15,846 |
| Standard Deviation (Sample) | $14,693 | $21,118 |
| Standard Deviation (Population) | $14,539 | $20,853 |
Demographics Similar to Peruvians and Immigrants from Korea by Householder Income Under 25 years
In terms of householder income under 25 years, the demographic groups most similar to Peruvians are Vietnamese ($56,127, a difference of 0.13%), Immigrants from Moldova ($56,168, a difference of 0.21%), Inupiat ($55,935, a difference of 0.21%), Immigrants from Japan ($55,932, a difference of 0.21%), and Tlingit-Haida ($55,914, a difference of 0.25%). Similarly, the demographic groups most similar to Immigrants from Korea are Immigrants from South Eastern Asia ($55,714, a difference of 0.0%), Immigrants from Greece ($55,727, a difference of 0.020%), Immigrants from Guyana ($55,726, a difference of 0.020%), Immigrants from Belarus ($55,743, a difference of 0.050%), and Paraguayan ($55,614, a difference of 0.18%).
| Demographics | Rating | Rank | Householder Income Under 25 years |
| Immigrants | North Macedonia | 100.0 /100 | #27 | Exceptional $56,503 |
| Immigrants | Peru | 100.0 /100 | #28 | Exceptional $56,384 |
| Immigrants | Asia | 100.0 /100 | #29 | Exceptional $56,379 |
| Immigrants | Moldova | 100.0 /100 | #30 | Exceptional $56,168 |
| Vietnamese | 100.0 /100 | #31 | Exceptional $56,127 |
| Peruvians | 100.0 /100 | #32 | Exceptional $56,052 |
| Inupiat | 100.0 /100 | #33 | Exceptional $55,935 |
| Immigrants | Japan | 100.0 /100 | #34 | Exceptional $55,932 |
| Tlingit-Haida | 100.0 /100 | #35 | Exceptional $55,914 |
| Immigrants | Israel | 100.0 /100 | #36 | Exceptional $55,913 |
| Immigrants | Russia | 100.0 /100 | #37 | Exceptional $55,891 |
| Immigrants | Iran | 100.0 /100 | #38 | Exceptional $55,880 |
| Immigrants | Belarus | 100.0 /100 | #39 | Exceptional $55,743 |
| Immigrants | Greece | 100.0 /100 | #40 | Exceptional $55,727 |
| Immigrants | Guyana | 100.0 /100 | #41 | Exceptional $55,726 |
| Immigrants | Korea | 100.0 /100 | #42 | Exceptional $55,716 |
| Immigrants | South Eastern Asia | 100.0 /100 | #43 | Exceptional $55,714 |
| Paraguayans | 100.0 /100 | #44 | Exceptional $55,614 |
| Spanish American Indians | 100.0 /100 | #45 | Exceptional $55,573 |
| Immigrants | Eastern Europe | 100.0 /100 | #46 | Exceptional $55,572 |
| Cambodians | 100.0 /100 | #47 | Exceptional $55,571 |