Native/Alaskan vs Chippewa Unemployment Among Ages 30 to 34 years
COMPARE
Native/Alaskan
Chippewa
Unemployment Among Ages 30 to 34 years
Unemployment Among Ages 30 to 34 years Comparison
Natives/Alaskans
Chippewa
8.2%
UNEMPLOYMENT AMONG AGES 30 TO 34 YEARS
0.0/ 100
METRIC RATING
332nd/ 347
METRIC RANK
7.8%
UNEMPLOYMENT AMONG AGES 30 TO 34 YEARS
0.0/ 100
METRIC RATING
328th/ 347
METRIC RANK
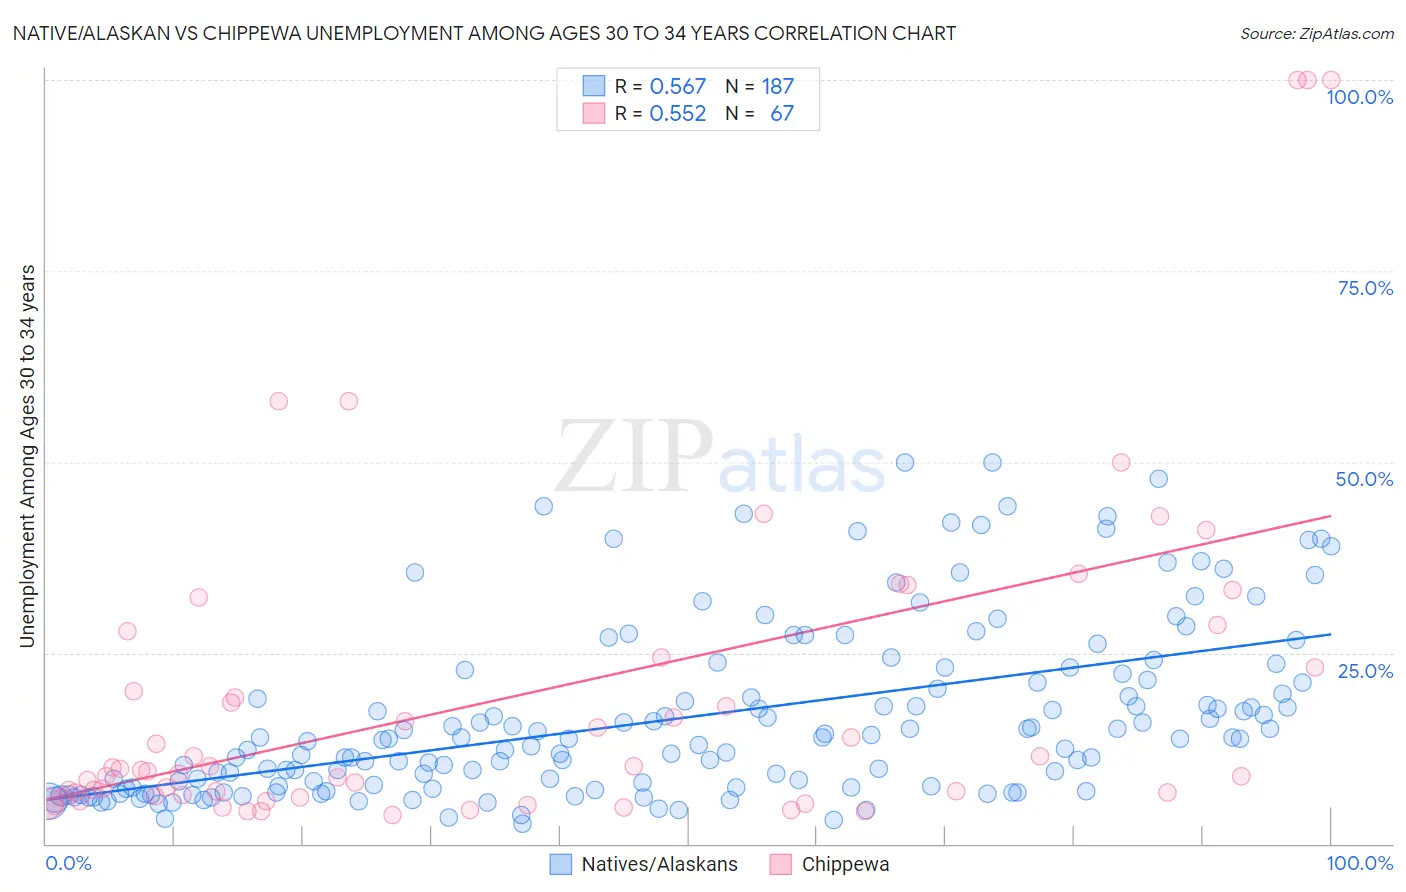
Native/Alaskan vs Chippewa Unemployment Among Ages 30 to 34 years Correlation Chart
The statistical analysis conducted on geographies consisting of 466,883,769 people shows a substantial positive correlation between the proportion of Natives/Alaskans and unemployment rate among population between the ages 30 and 34 in the United States with a correlation coefficient (R) of 0.567 and weighted average of 8.2%. Similarly, the statistical analysis conducted on geographies consisting of 205,184,240 people shows a substantial positive correlation between the proportion of Chippewa and unemployment rate among population between the ages 30 and 34 in the United States with a correlation coefficient (R) of 0.552 and weighted average of 7.8%, a difference of 6.2%.
Unemployment Among Ages 30 to 34 years Correlation Summary
| Measurement | Native/Alaskan | Chippewa |
| Minimum | 2.7% | 3.8% |
| Maximum | 50.0% | 100.0% |
| Range | 47.3% | 96.2% |
| Mean | 16.5% | 19.4% |
| Median | 13.7% | 9.7% |
| Interquartile 25% (IQ1) | 7.4% | 6.2% |
| Interquartile 75% (IQ3) | 21.4% | 24.4% |
| Interquartile Range (IQR) | 14.0% | 18.3% |
| Standard Deviation (Sample) | 11.3% | 22.2% |
| Standard Deviation (Population) | 11.3% | 22.1% |
Demographics Similar to Natives/Alaskans and Chippewa by Unemployment Among Ages 30 to 34 years
In terms of unemployment among ages 30 to 34 years, the demographic groups most similar to Natives/Alaskans are Pueblo (8.3%, a difference of 0.43%), Sioux (8.0%, a difference of 2.6%), Alaska Native (8.5%, a difference of 3.1%), Shoshone (7.9%, a difference of 4.1%), and Cheyenne (7.8%, a difference of 5.1%). Similarly, the demographic groups most similar to Chippewa are Immigrants from Dominican Republic (7.7%, a difference of 0.27%), Dominican (7.7%, a difference of 0.99%), Cheyenne (7.8%, a difference of 1.1%), Shoshone (7.9%, a difference of 2.0%), and Sioux (8.0%, a difference of 3.4%).
| Demographics | Rating | Rank | Unemployment Among Ages 30 to 34 years |
| Cape Verdeans | 0.0 /100 | #320 | Tragic 7.2% |
| Immigrants | Guyana | 0.0 /100 | #321 | Tragic 7.2% |
| Marshallese | 0.0 /100 | #322 | Tragic 7.2% |
| Immigrants | Yemen | 0.0 /100 | #323 | Tragic 7.3% |
| Immigrants | Dominica | 0.0 /100 | #324 | Tragic 7.3% |
| Apache | 0.0 /100 | #325 | Tragic 7.3% |
| Dominicans | 0.0 /100 | #326 | Tragic 7.7% |
| Immigrants | Dominican Republic | 0.0 /100 | #327 | Tragic 7.7% |
| Chippewa | 0.0 /100 | #328 | Tragic 7.8% |
| Cheyenne | 0.0 /100 | #329 | Tragic 7.8% |
| Shoshone | 0.0 /100 | #330 | Tragic 7.9% |
| Sioux | 0.0 /100 | #331 | Tragic 8.0% |
| Natives/Alaskans | 0.0 /100 | #332 | Tragic 8.2% |
| Pueblo | 0.0 /100 | #333 | Tragic 8.3% |
| Alaska Natives | 0.0 /100 | #334 | Tragic 8.5% |
| Puerto Ricans | 0.0 /100 | #335 | Tragic 8.9% |
| Colville | 0.0 /100 | #336 | Tragic 9.0% |
| Pima | 0.0 /100 | #337 | Tragic 9.6% |
| Yakama | 0.0 /100 | #338 | Tragic 9.8% |
| Tohono O'odham | 0.0 /100 | #339 | Tragic 9.8% |
| Crow | 0.0 /100 | #340 | Tragic 10.3% |