Immigrants from Thailand vs Chippewa No Vehicles in Household
COMPARE
Immigrants from Thailand
Chippewa
No Vehicles in Household
No Vehicles in Household Comparison
Immigrants from Thailand
Chippewa
9.5%
NO VEHICLES IN HOUSEHOLD
92.6/ 100
METRIC RATING
120th/ 347
METRIC RANK
9.4%
NO VEHICLES IN HOUSEHOLD
93.8/ 100
METRIC RATING
117th/ 347
METRIC RANK
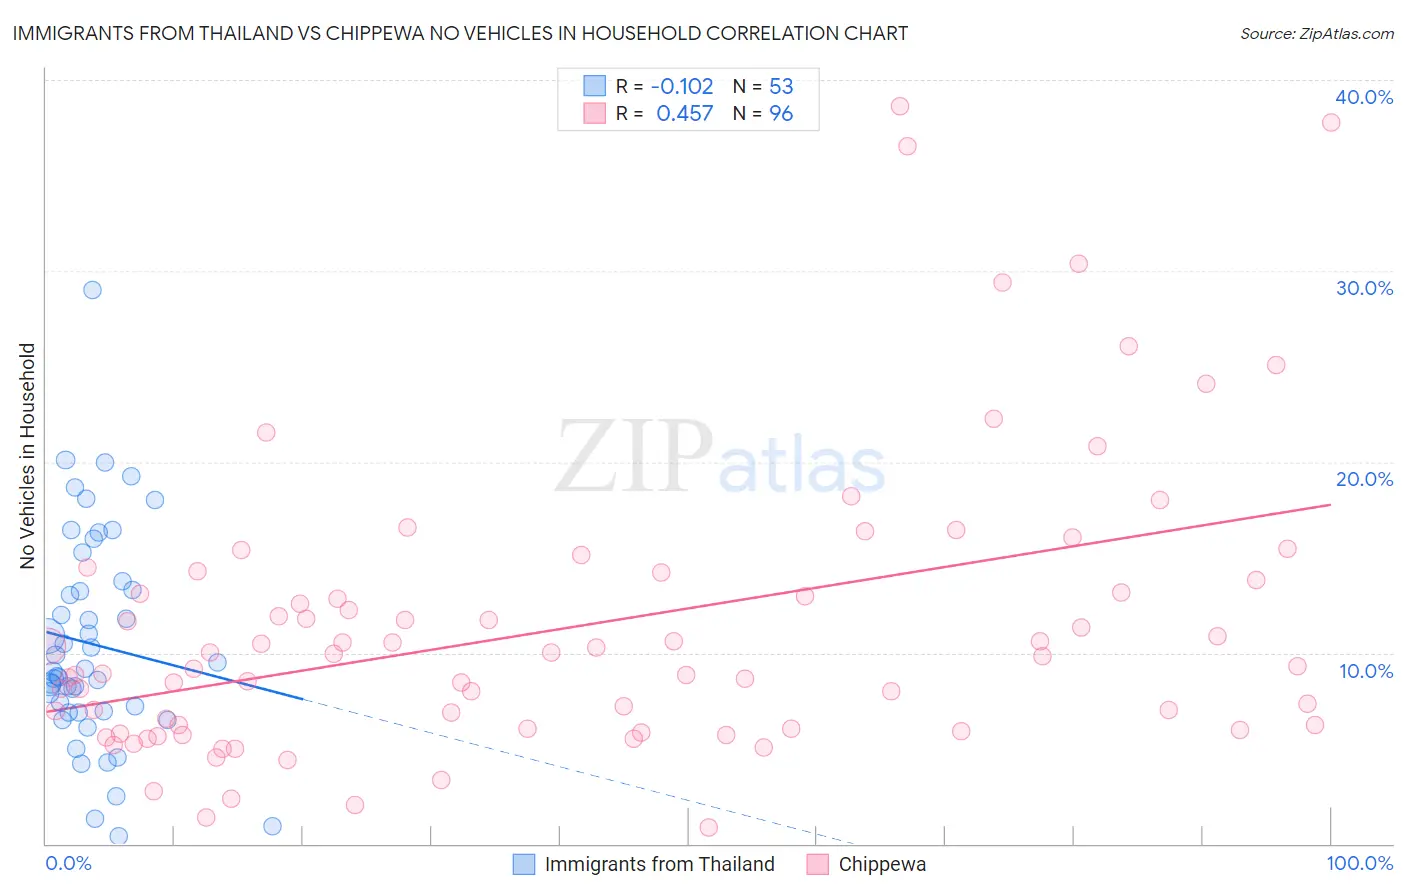
Immigrants from Thailand vs Chippewa No Vehicles in Household Correlation Chart
The statistical analysis conducted on geographies consisting of 316,566,006 people shows a poor negative correlation between the proportion of Immigrants from Thailand and percentage of households with no vehicle available in the United States with a correlation coefficient (R) of -0.102 and weighted average of 9.5%. Similarly, the statistical analysis conducted on geographies consisting of 214,718,200 people shows a moderate positive correlation between the proportion of Chippewa and percentage of households with no vehicle available in the United States with a correlation coefficient (R) of 0.457 and weighted average of 9.4%, a difference of 0.72%.
No Vehicles in Household Correlation Summary
| Measurement | Immigrants from Thailand | Chippewa |
| Minimum | 0.37% | 0.88% |
| Maximum | 29.0% | 38.6% |
| Range | 28.6% | 37.7% |
| Mean | 10.5% | 11.3% |
| Median | 9.0% | 9.5% |
| Interquartile 25% (IQ1) | 6.9% | 6.0% |
| Interquartile 75% (IQ3) | 13.5% | 13.5% |
| Interquartile Range (IQR) | 6.6% | 7.5% |
| Standard Deviation (Sample) | 5.6% | 7.6% |
| Standard Deviation (Population) | 5.5% | 7.5% |
Demographics Similar to Immigrants from Thailand and Chippewa by No Vehicles in Household
In terms of no vehicles in household, the demographic groups most similar to Immigrants from Thailand are Fijian (9.5%, a difference of 0.060%), Puget Sound Salish (9.5%, a difference of 0.10%), Costa Rican (9.5%, a difference of 0.15%), Greek (9.5%, a difference of 0.17%), and Blackfeet (9.6%, a difference of 0.61%). Similarly, the demographic groups most similar to Chippewa are Japanese (9.4%, a difference of 0.17%), Navajo (9.4%, a difference of 0.24%), Serbian (9.4%, a difference of 0.30%), Greek (9.5%, a difference of 0.55%), and Fijian (9.5%, a difference of 0.66%).
| Demographics | Rating | Rank | No Vehicles in Household |
| Mexican American Indians | 97.6 /100 | #108 | Exceptional 9.1% |
| Maltese | 97.6 /100 | #109 | Exceptional 9.1% |
| Delaware | 97.2 /100 | #110 | Exceptional 9.2% |
| Immigrants | Kuwait | 95.1 /100 | #111 | Exceptional 9.4% |
| Armenians | 95.0 /100 | #112 | Exceptional 9.4% |
| Immigrants | Netherlands | 94.8 /100 | #113 | Exceptional 9.4% |
| Serbians | 94.3 /100 | #114 | Exceptional 9.4% |
| Navajo | 94.2 /100 | #115 | Exceptional 9.4% |
| Japanese | 94.1 /100 | #116 | Exceptional 9.4% |
| Chippewa | 93.8 /100 | #117 | Exceptional 9.4% |
| Greeks | 92.9 /100 | #118 | Exceptional 9.5% |
| Fijians | 92.7 /100 | #119 | Exceptional 9.5% |
| Immigrants | Thailand | 92.6 /100 | #120 | Exceptional 9.5% |
| Puget Sound Salish | 92.4 /100 | #121 | Exceptional 9.5% |
| Costa Ricans | 92.3 /100 | #122 | Exceptional 9.5% |
| Blackfeet | 91.4 /100 | #123 | Exceptional 9.6% |
| Immigrants | Korea | 90.9 /100 | #124 | Exceptional 9.6% |
| Immigrants | Cameroon | 90.6 /100 | #125 | Exceptional 9.6% |
| Icelanders | 90.2 /100 | #126 | Exceptional 9.6% |
| Immigrants | Kenya | 89.7 /100 | #127 | Excellent 9.6% |
| Immigrants | Syria | 89.5 /100 | #128 | Excellent 9.6% |