Immigrants from Moldova vs Chippewa No Vehicles in Household
COMPARE
Immigrants from Moldova
Chippewa
No Vehicles in Household
No Vehicles in Household Comparison
Immigrants from Moldova
Chippewa
9.8%
NO VEHICLES IN HOUSEHOLD
84.6/ 100
METRIC RATING
137th/ 347
METRIC RANK
9.4%
NO VEHICLES IN HOUSEHOLD
93.8/ 100
METRIC RATING
117th/ 347
METRIC RANK
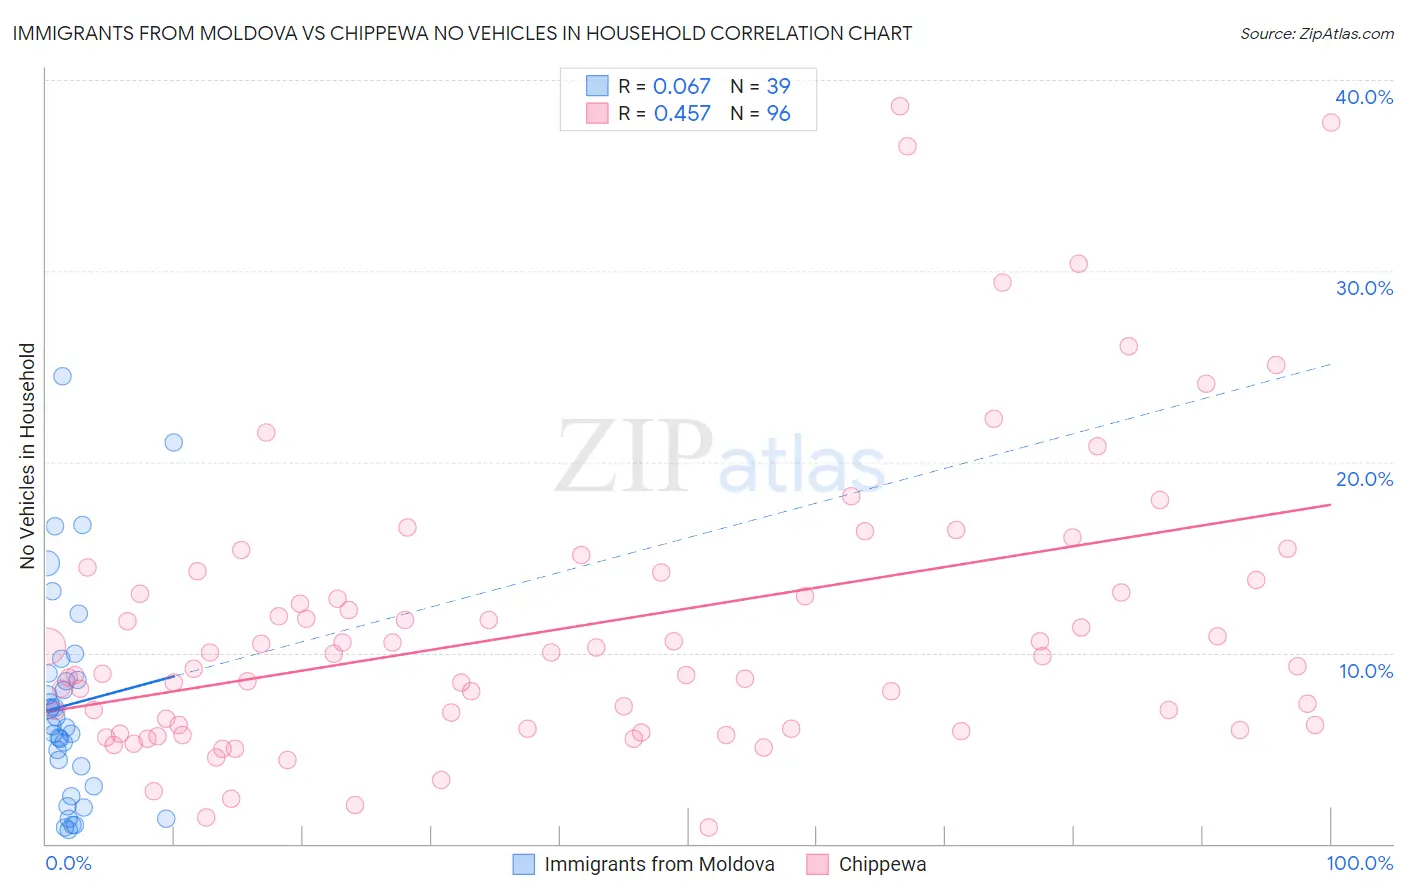
Immigrants from Moldova vs Chippewa No Vehicles in Household Correlation Chart
The statistical analysis conducted on geographies consisting of 124,267,195 people shows a slight positive correlation between the proportion of Immigrants from Moldova and percentage of households with no vehicle available in the United States with a correlation coefficient (R) of 0.067 and weighted average of 9.8%. Similarly, the statistical analysis conducted on geographies consisting of 214,718,200 people shows a moderate positive correlation between the proportion of Chippewa and percentage of households with no vehicle available in the United States with a correlation coefficient (R) of 0.457 and weighted average of 9.4%, a difference of 3.8%.
No Vehicles in Household Correlation Summary
| Measurement | Immigrants from Moldova | Chippewa |
| Minimum | 0.71% | 0.88% |
| Maximum | 24.5% | 38.6% |
| Range | 23.8% | 37.7% |
| Mean | 7.3% | 11.3% |
| Median | 6.2% | 9.5% |
| Interquartile 25% (IQ1) | 3.0% | 6.0% |
| Interquartile 75% (IQ3) | 8.9% | 13.5% |
| Interquartile Range (IQR) | 5.9% | 7.5% |
| Standard Deviation (Sample) | 5.5% | 7.6% |
| Standard Deviation (Population) | 5.5% | 7.5% |
Demographics Similar to Immigrants from Moldova and Chippewa by No Vehicles in Household
In terms of no vehicles in household, the demographic groups most similar to Immigrants from Moldova are Immigrants from South Africa (9.8%, a difference of 0.10%), Latvian (9.8%, a difference of 0.15%), Syrian (9.7%, a difference of 0.73%), Immigrants from Oceania (9.7%, a difference of 0.75%), and Kenyan (9.7%, a difference of 1.1%). Similarly, the demographic groups most similar to Chippewa are Greek (9.5%, a difference of 0.55%), Fijian (9.5%, a difference of 0.66%), Immigrants from Thailand (9.5%, a difference of 0.72%), Puget Sound Salish (9.5%, a difference of 0.82%), and Costa Rican (9.5%, a difference of 0.87%).
| Demographics | Rating | Rank | No Vehicles in Household |
| Chippewa | 93.8 /100 | #117 | Exceptional 9.4% |
| Greeks | 92.9 /100 | #118 | Exceptional 9.5% |
| Fijians | 92.7 /100 | #119 | Exceptional 9.5% |
| Immigrants | Thailand | 92.6 /100 | #120 | Exceptional 9.5% |
| Puget Sound Salish | 92.4 /100 | #121 | Exceptional 9.5% |
| Costa Ricans | 92.3 /100 | #122 | Exceptional 9.5% |
| Blackfeet | 91.4 /100 | #123 | Exceptional 9.6% |
| Immigrants | Korea | 90.9 /100 | #124 | Exceptional 9.6% |
| Immigrants | Cameroon | 90.6 /100 | #125 | Exceptional 9.6% |
| Icelanders | 90.2 /100 | #126 | Exceptional 9.6% |
| Immigrants | Kenya | 89.7 /100 | #127 | Excellent 9.6% |
| Immigrants | Syria | 89.5 /100 | #128 | Excellent 9.6% |
| Nicaraguans | 89.5 /100 | #129 | Excellent 9.7% |
| Burmese | 88.8 /100 | #130 | Excellent 9.7% |
| Immigrants | Azores | 88.2 /100 | #131 | Excellent 9.7% |
| Kenyans | 88.0 /100 | #132 | Excellent 9.7% |
| Immigrants | Oceania | 87.1 /100 | #133 | Excellent 9.7% |
| Syrians | 87.1 /100 | #134 | Excellent 9.7% |
| Latvians | 85.1 /100 | #135 | Excellent 9.8% |
| Immigrants | South Africa | 85.0 /100 | #136 | Excellent 9.8% |
| Immigrants | Moldova | 84.6 /100 | #137 | Excellent 9.8% |