Bermudan vs Chippewa No Vehicles in Household
COMPARE
Bermudan
Chippewa
No Vehicles in Household
No Vehicles in Household Comparison
Bermudans
Chippewa
12.8%
NO VEHICLES IN HOUSEHOLD
0.1/ 100
METRIC RATING
272nd/ 347
METRIC RANK
9.4%
NO VEHICLES IN HOUSEHOLD
93.8/ 100
METRIC RATING
117th/ 347
METRIC RANK
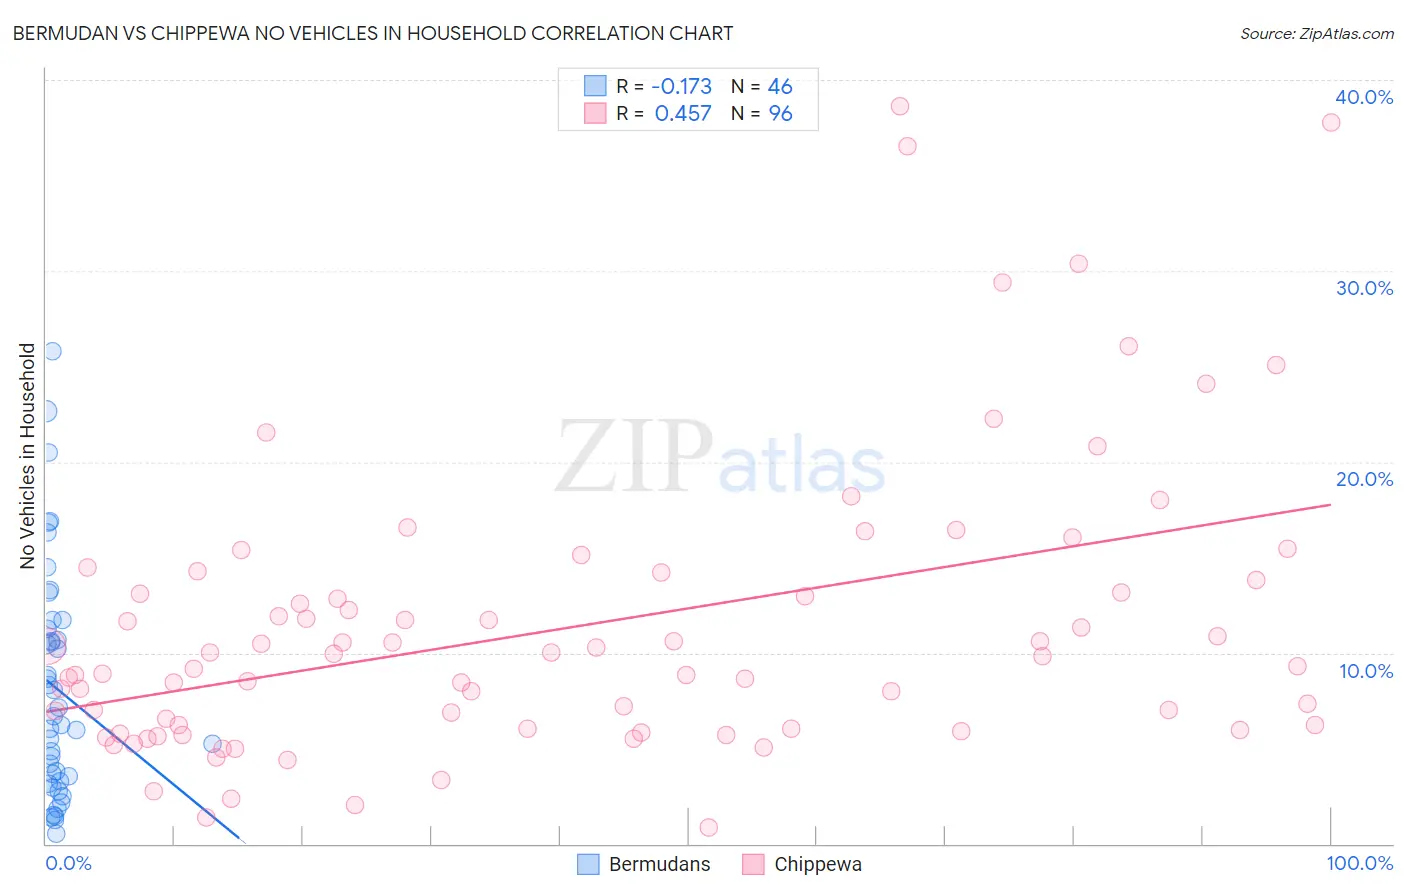
Bermudan vs Chippewa No Vehicles in Household Correlation Chart
The statistical analysis conducted on geographies consisting of 55,615,567 people shows a poor negative correlation between the proportion of Bermudans and percentage of households with no vehicle available in the United States with a correlation coefficient (R) of -0.173 and weighted average of 12.8%. Similarly, the statistical analysis conducted on geographies consisting of 214,718,200 people shows a moderate positive correlation between the proportion of Chippewa and percentage of households with no vehicle available in the United States with a correlation coefficient (R) of 0.457 and weighted average of 9.4%, a difference of 35.3%.
No Vehicles in Household Correlation Summary
| Measurement | Bermudan | Chippewa |
| Minimum | 0.54% | 0.88% |
| Maximum | 25.8% | 38.6% |
| Range | 25.3% | 37.7% |
| Mean | 8.1% | 11.3% |
| Median | 6.5% | 9.5% |
| Interquartile 25% (IQ1) | 3.2% | 6.0% |
| Interquartile 75% (IQ3) | 11.3% | 13.5% |
| Interquartile Range (IQR) | 8.0% | 7.5% |
| Standard Deviation (Sample) | 6.0% | 7.6% |
| Standard Deviation (Population) | 6.0% | 7.5% |
Similar Demographics by No Vehicles in Household
Demographics Similar to Bermudans by No Vehicles in Household
In terms of no vehicles in household, the demographic groups most similar to Bermudans are Immigrants from France (12.9%, a difference of 1.2%), Immigrants from Singapore (12.9%, a difference of 1.3%), Immigrants from Morocco (12.6%, a difference of 1.3%), Immigrants from Northern Africa (12.6%, a difference of 1.4%), and Immigrants from Albania (13.0%, a difference of 1.5%).
| Demographics | Rating | Rank | No Vehicles in Household |
| Africans | 0.4 /100 | #265 | Tragic 12.3% |
| Israelis | 0.3 /100 | #266 | Tragic 12.4% |
| Immigrants | Europe | 0.3 /100 | #267 | Tragic 12.5% |
| Immigrants | Africa | 0.2 /100 | #268 | Tragic 12.5% |
| Panamanians | 0.2 /100 | #269 | Tragic 12.5% |
| Immigrants | Northern Africa | 0.2 /100 | #270 | Tragic 12.6% |
| Immigrants | Morocco | 0.2 /100 | #271 | Tragic 12.6% |
| Bermudans | 0.1 /100 | #272 | Tragic 12.8% |
| Immigrants | France | 0.1 /100 | #273 | Tragic 12.9% |
| Immigrants | Singapore | 0.1 /100 | #274 | Tragic 12.9% |
| Immigrants | Albania | 0.1 /100 | #275 | Tragic 13.0% |
| Immigrants | Southern Europe | 0.1 /100 | #276 | Tragic 13.0% |
| Aleuts | 0.1 /100 | #277 | Tragic 13.0% |
| Immigrants | Croatia | 0.1 /100 | #278 | Tragic 13.0% |
| Mongolians | 0.0 /100 | #279 | Tragic 13.1% |
Demographics Similar to Chippewa by No Vehicles in Household
In terms of no vehicles in household, the demographic groups most similar to Chippewa are Japanese (9.4%, a difference of 0.17%), Navajo (9.4%, a difference of 0.24%), Serbian (9.4%, a difference of 0.30%), Greek (9.5%, a difference of 0.55%), and Fijian (9.5%, a difference of 0.66%).
| Demographics | Rating | Rank | No Vehicles in Household |
| Delaware | 97.2 /100 | #110 | Exceptional 9.2% |
| Immigrants | Kuwait | 95.1 /100 | #111 | Exceptional 9.4% |
| Armenians | 95.0 /100 | #112 | Exceptional 9.4% |
| Immigrants | Netherlands | 94.8 /100 | #113 | Exceptional 9.4% |
| Serbians | 94.3 /100 | #114 | Exceptional 9.4% |
| Navajo | 94.2 /100 | #115 | Exceptional 9.4% |
| Japanese | 94.1 /100 | #116 | Exceptional 9.4% |
| Chippewa | 93.8 /100 | #117 | Exceptional 9.4% |
| Greeks | 92.9 /100 | #118 | Exceptional 9.5% |
| Fijians | 92.7 /100 | #119 | Exceptional 9.5% |
| Immigrants | Thailand | 92.6 /100 | #120 | Exceptional 9.5% |
| Puget Sound Salish | 92.4 /100 | #121 | Exceptional 9.5% |
| Costa Ricans | 92.3 /100 | #122 | Exceptional 9.5% |
| Blackfeet | 91.4 /100 | #123 | Exceptional 9.6% |
| Immigrants | Korea | 90.9 /100 | #124 | Exceptional 9.6% |