Lithuanian vs Immigrants from Europe 3 or more Vehicles in Household
COMPARE
Lithuanian
Immigrants from Europe
3 or more Vehicles in Household
3 or more Vehicles in Household Comparison
Lithuanians
Immigrants from Europe
20.1%
3 OR MORE VEHICLES IN HOUSEHOLD
84.4/ 100
METRIC RATING
143rd/ 347
METRIC RANK
18.1%
3 OR MORE VEHICLES IN HOUSEHOLD
2.4/ 100
METRIC RATING
243rd/ 347
METRIC RANK
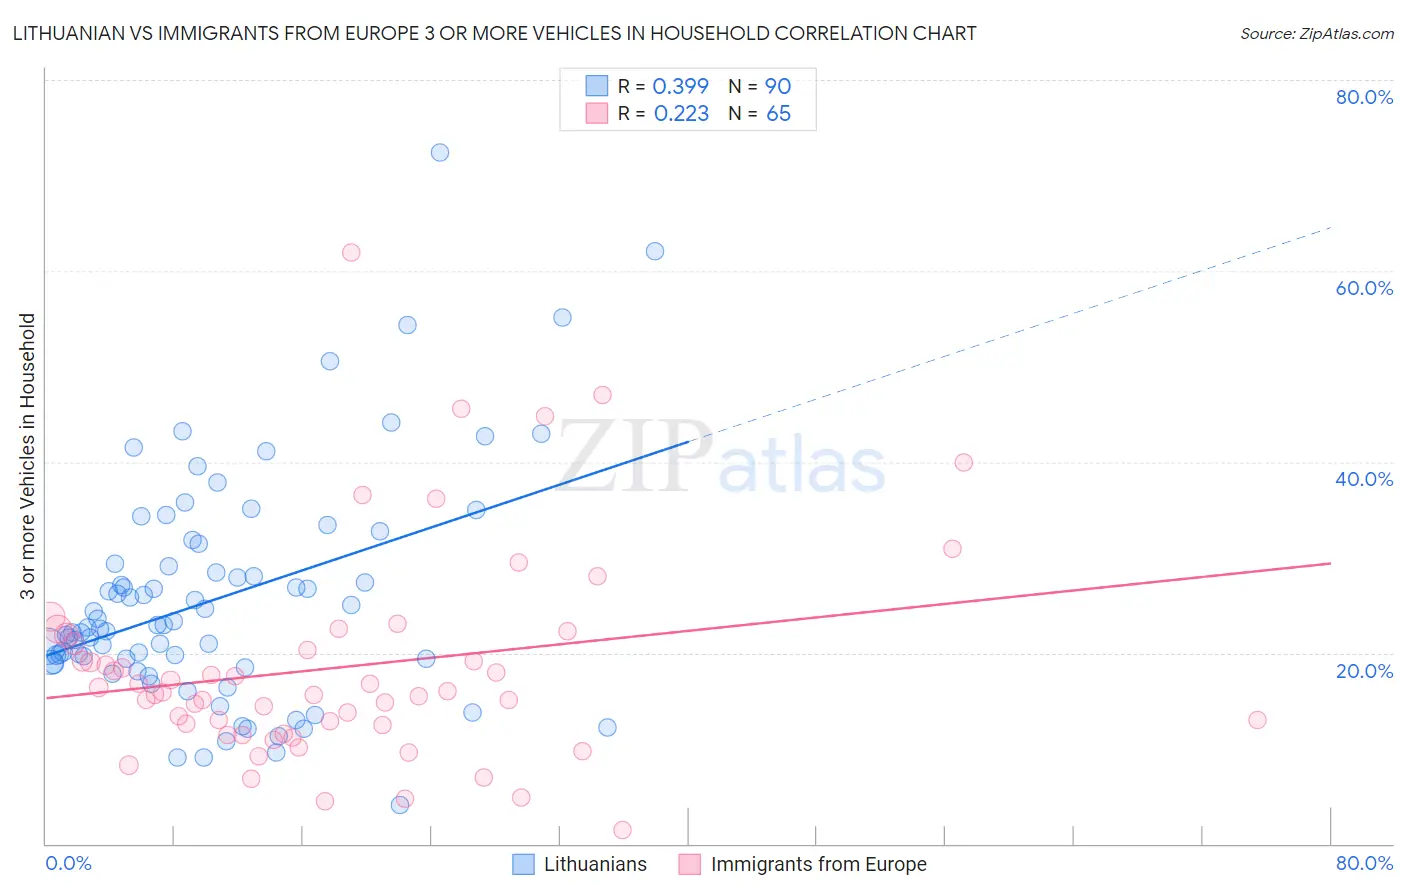
Lithuanian vs Immigrants from Europe 3 or more Vehicles in Household Correlation Chart
The statistical analysis conducted on geographies consisting of 421,577,251 people shows a mild positive correlation between the proportion of Lithuanians and percentage of households with 3 or more vehicles available in the United States with a correlation coefficient (R) of 0.399 and weighted average of 20.1%. Similarly, the statistical analysis conducted on geographies consisting of 546,637,785 people shows a weak positive correlation between the proportion of Immigrants from Europe and percentage of households with 3 or more vehicles available in the United States with a correlation coefficient (R) of 0.223 and weighted average of 18.1%, a difference of 11.0%.
3 or more Vehicles in Household Correlation Summary
| Measurement | Lithuanian | Immigrants from Europe |
| Minimum | 4.1% | 1.4% |
| Maximum | 72.4% | 61.9% |
| Range | 68.4% | 60.5% |
| Mean | 25.6% | 18.5% |
| Median | 22.8% | 15.9% |
| Interquartile 25% (IQ1) | 19.0% | 11.9% |
| Interquartile 75% (IQ3) | 29.4% | 21.4% |
| Interquartile Range (IQR) | 10.4% | 9.5% |
| Standard Deviation (Sample) | 12.0% | 11.1% |
| Standard Deviation (Population) | 11.9% | 11.0% |
Similar Demographics by 3 or more Vehicles in Household
Demographics Similar to Lithuanians by 3 or more Vehicles in Household
In terms of 3 or more vehicles in household, the demographic groups most similar to Lithuanians are Jordanian (20.1%, a difference of 0.0%), Iranian (20.1%, a difference of 0.050%), Palestinian (20.1%, a difference of 0.060%), Ottawa (20.1%, a difference of 0.070%), and Australian (20.1%, a difference of 0.11%).
| Demographics | Rating | Rank | 3 or more Vehicles in Household |
| Immigrants | Nicaragua | 87.1 /100 | #136 | Excellent 20.2% |
| Immigrants | Iraq | 87.1 /100 | #137 | Excellent 20.2% |
| Aleuts | 86.3 /100 | #138 | Excellent 20.2% |
| Slovenes | 85.5 /100 | #139 | Excellent 20.2% |
| French American Indians | 85.3 /100 | #140 | Excellent 20.1% |
| Ottawa | 84.9 /100 | #141 | Excellent 20.1% |
| Jordanians | 84.4 /100 | #142 | Excellent 20.1% |
| Lithuanians | 84.4 /100 | #143 | Excellent 20.1% |
| Iranians | 84.0 /100 | #144 | Excellent 20.1% |
| Palestinians | 83.9 /100 | #145 | Excellent 20.1% |
| Australians | 83.6 /100 | #146 | Excellent 20.1% |
| Slovaks | 83.0 /100 | #147 | Excellent 20.1% |
| Guatemalans | 82.6 /100 | #148 | Excellent 20.1% |
| Immigrants | Iran | 80.9 /100 | #149 | Excellent 20.0% |
| Immigrants | Immigrants | 80.8 /100 | #150 | Excellent 20.0% |
Demographics Similar to Immigrants from Europe by 3 or more Vehicles in Household
In terms of 3 or more vehicles in household, the demographic groups most similar to Immigrants from Europe are Hopi (18.2%, a difference of 0.12%), Mongolian (18.1%, a difference of 0.12%), African (18.2%, a difference of 0.23%), Immigrants from Belize (18.1%, a difference of 0.28%), and Immigrants from Australia (18.1%, a difference of 0.35%).
| Demographics | Rating | Rank | 3 or more Vehicles in Household |
| Immigrants | Malaysia | 3.6 /100 | #236 | Tragic 18.3% |
| Indonesians | 3.5 /100 | #237 | Tragic 18.3% |
| Immigrants | Honduras | 3.1 /100 | #238 | Tragic 18.2% |
| Immigrants | Middle Africa | 3.1 /100 | #239 | Tragic 18.2% |
| Immigrants | China | 2.9 /100 | #240 | Tragic 18.2% |
| Africans | 2.7 /100 | #241 | Tragic 18.2% |
| Hopi | 2.5 /100 | #242 | Tragic 18.2% |
| Immigrants | Europe | 2.4 /100 | #243 | Tragic 18.1% |
| Mongolians | 2.3 /100 | #244 | Tragic 18.1% |
| Immigrants | Belize | 2.1 /100 | #245 | Tragic 18.1% |
| Immigrants | Australia | 2.0 /100 | #246 | Tragic 18.1% |
| Carpatho Rusyns | 1.9 /100 | #247 | Tragic 18.0% |
| Immigrants | Eastern Africa | 1.8 /100 | #248 | Tragic 18.0% |
| Immigrants | Saudi Arabia | 1.7 /100 | #249 | Tragic 18.0% |
| Venezuelans | 1.7 /100 | #250 | Tragic 18.0% |