Immigrants from Bulgaria vs Immigrants from Europe 3 or more Vehicles in Household
COMPARE
Immigrants from Bulgaria
Immigrants from Europe
3 or more Vehicles in Household
3 or more Vehicles in Household Comparison
Immigrants from Bulgaria
Immigrants from Europe
17.7%
3 OR MORE VEHICLES IN HOUSEHOLD
0.8/ 100
METRIC RATING
268th/ 347
METRIC RANK
18.1%
3 OR MORE VEHICLES IN HOUSEHOLD
2.4/ 100
METRIC RATING
243rd/ 347
METRIC RANK
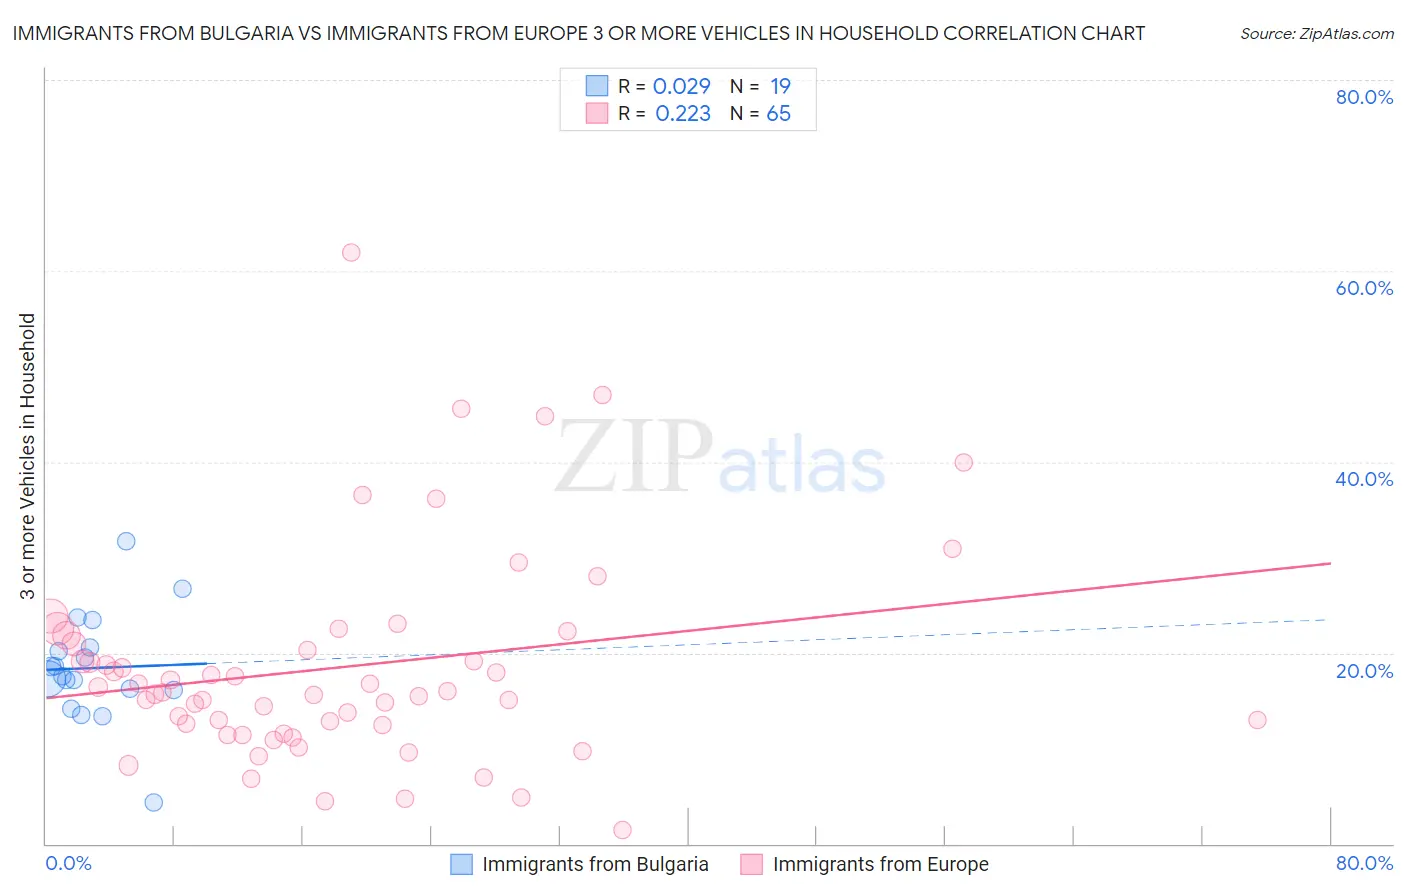
Immigrants from Bulgaria vs Immigrants from Europe 3 or more Vehicles in Household Correlation Chart
The statistical analysis conducted on geographies consisting of 172,519,366 people shows no correlation between the proportion of Immigrants from Bulgaria and percentage of households with 3 or more vehicles available in the United States with a correlation coefficient (R) of 0.029 and weighted average of 17.7%. Similarly, the statistical analysis conducted on geographies consisting of 546,637,785 people shows a weak positive correlation between the proportion of Immigrants from Europe and percentage of households with 3 or more vehicles available in the United States with a correlation coefficient (R) of 0.223 and weighted average of 18.1%, a difference of 2.4%.
3 or more Vehicles in Household Correlation Summary
| Measurement | Immigrants from Bulgaria | Immigrants from Europe |
| Minimum | 4.4% | 1.4% |
| Maximum | 31.6% | 61.9% |
| Range | 27.3% | 60.5% |
| Mean | 18.4% | 18.5% |
| Median | 17.6% | 15.9% |
| Interquartile 25% (IQ1) | 16.1% | 11.9% |
| Interquartile 75% (IQ3) | 20.5% | 21.4% |
| Interquartile Range (IQR) | 4.4% | 9.5% |
| Standard Deviation (Sample) | 5.7% | 11.1% |
| Standard Deviation (Population) | 5.5% | 11.0% |
Similar Demographics by 3 or more Vehicles in Household
Demographics Similar to Immigrants from Bulgaria by 3 or more Vehicles in Household
In terms of 3 or more vehicles in household, the demographic groups most similar to Immigrants from Bulgaria are Immigrants from Venezuela (17.7%, a difference of 0.010%), Macedonian (17.7%, a difference of 0.070%), Immigrants from Panama (17.7%, a difference of 0.090%), Cambodian (17.8%, a difference of 0.23%), and Bermudan (17.8%, a difference of 0.26%).
| Demographics | Rating | Rank | 3 or more Vehicles in Household |
| Immigrants | Northern Africa | 0.9 /100 | #261 | Tragic 17.8% |
| Colombians | 0.9 /100 | #262 | Tragic 17.8% |
| Bermudans | 0.9 /100 | #263 | Tragic 17.8% |
| Cambodians | 0.9 /100 | #264 | Tragic 17.8% |
| Immigrants | Panama | 0.8 /100 | #265 | Tragic 17.7% |
| Macedonians | 0.8 /100 | #266 | Tragic 17.7% |
| Immigrants | Venezuela | 0.8 /100 | #267 | Tragic 17.7% |
| Immigrants | Bulgaria | 0.8 /100 | #268 | Tragic 17.7% |
| Immigrants | France | 0.6 /100 | #269 | Tragic 17.6% |
| Immigrants | Nepal | 0.6 /100 | #270 | Tragic 17.6% |
| South Americans | 0.6 /100 | #271 | Tragic 17.6% |
| Immigrants | Africa | 0.5 /100 | #272 | Tragic 17.6% |
| Immigrants | Sudan | 0.5 /100 | #273 | Tragic 17.6% |
| Immigrants | Bosnia and Herzegovina | 0.5 /100 | #274 | Tragic 17.5% |
| Immigrants | Ukraine | 0.4 /100 | #275 | Tragic 17.5% |
Demographics Similar to Immigrants from Europe by 3 or more Vehicles in Household
In terms of 3 or more vehicles in household, the demographic groups most similar to Immigrants from Europe are Hopi (18.2%, a difference of 0.12%), Mongolian (18.1%, a difference of 0.12%), African (18.2%, a difference of 0.23%), Immigrants from Belize (18.1%, a difference of 0.28%), and Immigrants from Australia (18.1%, a difference of 0.35%).
| Demographics | Rating | Rank | 3 or more Vehicles in Household |
| Immigrants | Malaysia | 3.6 /100 | #236 | Tragic 18.3% |
| Indonesians | 3.5 /100 | #237 | Tragic 18.3% |
| Immigrants | Honduras | 3.1 /100 | #238 | Tragic 18.2% |
| Immigrants | Middle Africa | 3.1 /100 | #239 | Tragic 18.2% |
| Immigrants | China | 2.9 /100 | #240 | Tragic 18.2% |
| Africans | 2.7 /100 | #241 | Tragic 18.2% |
| Hopi | 2.5 /100 | #242 | Tragic 18.2% |
| Immigrants | Europe | 2.4 /100 | #243 | Tragic 18.1% |
| Mongolians | 2.3 /100 | #244 | Tragic 18.1% |
| Immigrants | Belize | 2.1 /100 | #245 | Tragic 18.1% |
| Immigrants | Australia | 2.0 /100 | #246 | Tragic 18.1% |
| Carpatho Rusyns | 1.9 /100 | #247 | Tragic 18.0% |
| Immigrants | Eastern Africa | 1.8 /100 | #248 | Tragic 18.0% |
| Immigrants | Saudi Arabia | 1.7 /100 | #249 | Tragic 18.0% |
| Venezuelans | 1.7 /100 | #250 | Tragic 18.0% |