Lithuanian vs Lumbee 3 or more Vehicles in Household
COMPARE
Lithuanian
Lumbee
3 or more Vehicles in Household
3 or more Vehicles in Household Comparison
Lithuanians
Lumbee
20.1%
3 OR MORE VEHICLES IN HOUSEHOLD
84.4/ 100
METRIC RATING
143rd/ 347
METRIC RANK
23.1%
3 OR MORE VEHICLES IN HOUSEHOLD
100.0/ 100
METRIC RATING
28th/ 347
METRIC RANK
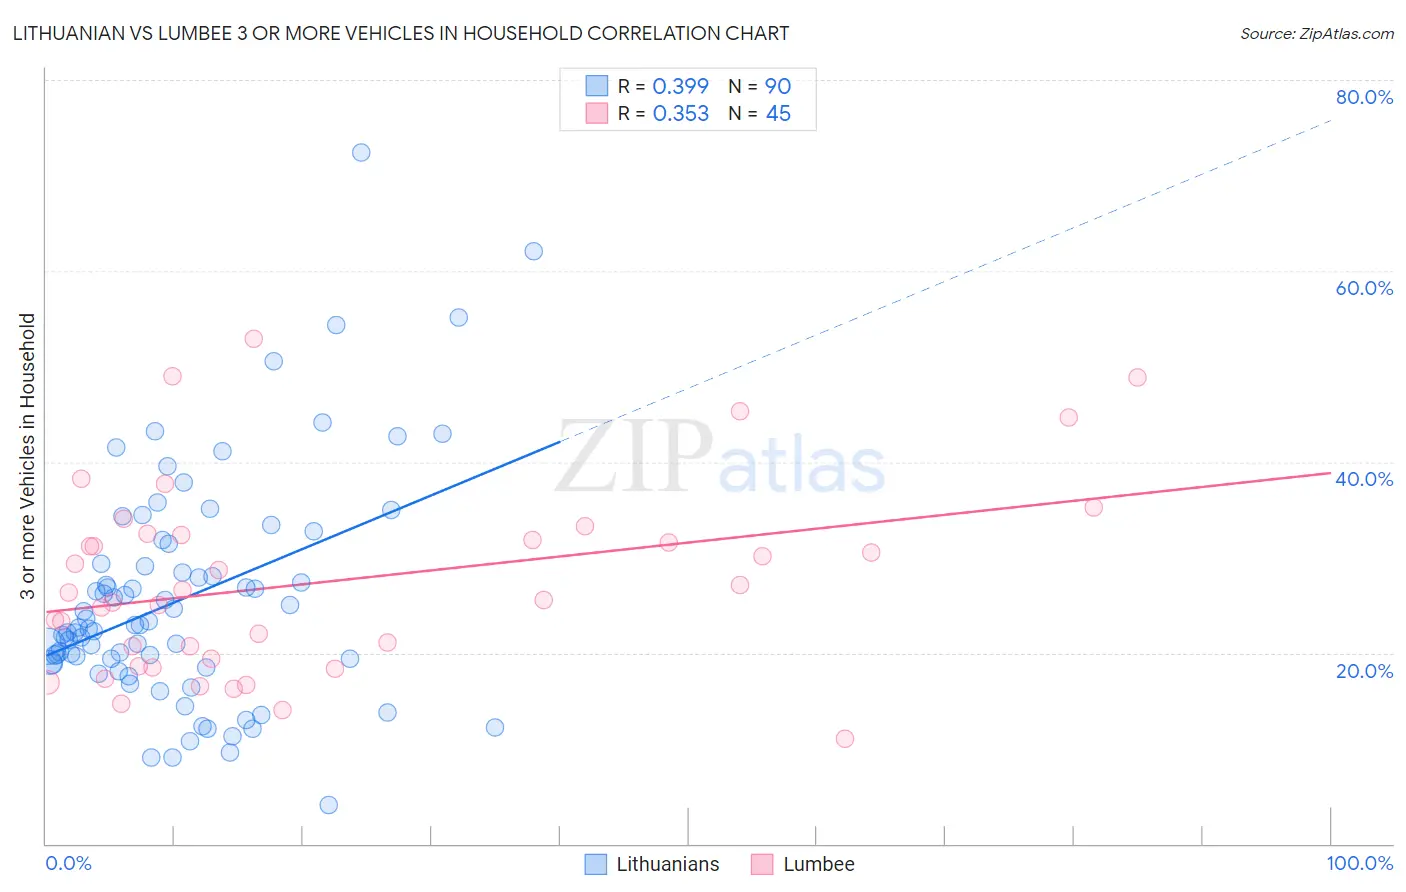
Lithuanian vs Lumbee 3 or more Vehicles in Household Correlation Chart
The statistical analysis conducted on geographies consisting of 421,577,251 people shows a mild positive correlation between the proportion of Lithuanians and percentage of households with 3 or more vehicles available in the United States with a correlation coefficient (R) of 0.399 and weighted average of 20.1%. Similarly, the statistical analysis conducted on geographies consisting of 92,258,443 people shows a mild positive correlation between the proportion of Lumbee and percentage of households with 3 or more vehicles available in the United States with a correlation coefficient (R) of 0.353 and weighted average of 23.1%, a difference of 15.0%.
3 or more Vehicles in Household Correlation Summary
| Measurement | Lithuanian | Lumbee |
| Minimum | 4.1% | 10.9% |
| Maximum | 72.4% | 53.0% |
| Range | 68.4% | 42.0% |
| Mean | 25.6% | 27.5% |
| Median | 22.8% | 26.3% |
| Interquartile 25% (IQ1) | 19.0% | 19.0% |
| Interquartile 75% (IQ3) | 29.4% | 32.4% |
| Interquartile Range (IQR) | 10.4% | 13.4% |
| Standard Deviation (Sample) | 12.0% | 10.0% |
| Standard Deviation (Population) | 11.9% | 9.9% |
Similar Demographics by 3 or more Vehicles in Household
Demographics Similar to Lithuanians by 3 or more Vehicles in Household
In terms of 3 or more vehicles in household, the demographic groups most similar to Lithuanians are Jordanian (20.1%, a difference of 0.0%), Iranian (20.1%, a difference of 0.050%), Palestinian (20.1%, a difference of 0.060%), Ottawa (20.1%, a difference of 0.070%), and Australian (20.1%, a difference of 0.11%).
| Demographics | Rating | Rank | 3 or more Vehicles in Household |
| Immigrants | Nicaragua | 87.1 /100 | #136 | Excellent 20.2% |
| Immigrants | Iraq | 87.1 /100 | #137 | Excellent 20.2% |
| Aleuts | 86.3 /100 | #138 | Excellent 20.2% |
| Slovenes | 85.5 /100 | #139 | Excellent 20.2% |
| French American Indians | 85.3 /100 | #140 | Excellent 20.1% |
| Ottawa | 84.9 /100 | #141 | Excellent 20.1% |
| Jordanians | 84.4 /100 | #142 | Excellent 20.1% |
| Lithuanians | 84.4 /100 | #143 | Excellent 20.1% |
| Iranians | 84.0 /100 | #144 | Excellent 20.1% |
| Palestinians | 83.9 /100 | #145 | Excellent 20.1% |
| Australians | 83.6 /100 | #146 | Excellent 20.1% |
| Slovaks | 83.0 /100 | #147 | Excellent 20.1% |
| Guatemalans | 82.6 /100 | #148 | Excellent 20.1% |
| Immigrants | Iran | 80.9 /100 | #149 | Excellent 20.0% |
| Immigrants | Immigrants | 80.8 /100 | #150 | Excellent 20.0% |
Demographics Similar to Lumbee by 3 or more Vehicles in Household
In terms of 3 or more vehicles in household, the demographic groups most similar to Lumbee are Spanish (23.1%, a difference of 0.070%), Immigrants from South Eastern Asia (23.1%, a difference of 0.24%), Guamanian/Chamorro (23.2%, a difference of 0.33%), English (23.1%, a difference of 0.43%), and Mexican American Indian (23.3%, a difference of 0.47%).
| Demographics | Rating | Rank | 3 or more Vehicles in Household |
| Immigrants | Vietnam | 100.0 /100 | #21 | Exceptional 23.8% |
| Immigrants | Philippines | 100.0 /100 | #22 | Exceptional 23.8% |
| Scandinavians | 100.0 /100 | #23 | Exceptional 23.6% |
| Sri Lankans | 100.0 /100 | #24 | Exceptional 23.6% |
| Immigrants | Central America | 100.0 /100 | #25 | Exceptional 23.4% |
| Mexican American Indians | 100.0 /100 | #26 | Exceptional 23.3% |
| Guamanians/Chamorros | 100.0 /100 | #27 | Exceptional 23.2% |
| Lumbee | 100.0 /100 | #28 | Exceptional 23.1% |
| Spanish | 100.0 /100 | #29 | Exceptional 23.1% |
| Immigrants | South Eastern Asia | 100.0 /100 | #30 | Exceptional 23.1% |
| English | 100.0 /100 | #31 | Exceptional 23.1% |
| Pueblo | 100.0 /100 | #32 | Exceptional 23.0% |
| Spanish Americans | 100.0 /100 | #33 | Exceptional 23.0% |
| Swiss | 100.0 /100 | #34 | Exceptional 23.0% |
| Choctaw | 100.0 /100 | #35 | Exceptional 23.0% |