Immigrants from the Azores vs Immigrants from Europe 3 or more Vehicles in Household
COMPARE
Immigrants from the Azores
Immigrants from Europe
3 or more Vehicles in Household
3 or more Vehicles in Household Comparison
Immigrants from the Azores
Immigrants from Europe
21.5%
3 OR MORE VEHICLES IN HOUSEHOLD
99.5/ 100
METRIC RATING
87th/ 347
METRIC RANK
18.1%
3 OR MORE VEHICLES IN HOUSEHOLD
2.4/ 100
METRIC RATING
243rd/ 347
METRIC RANK
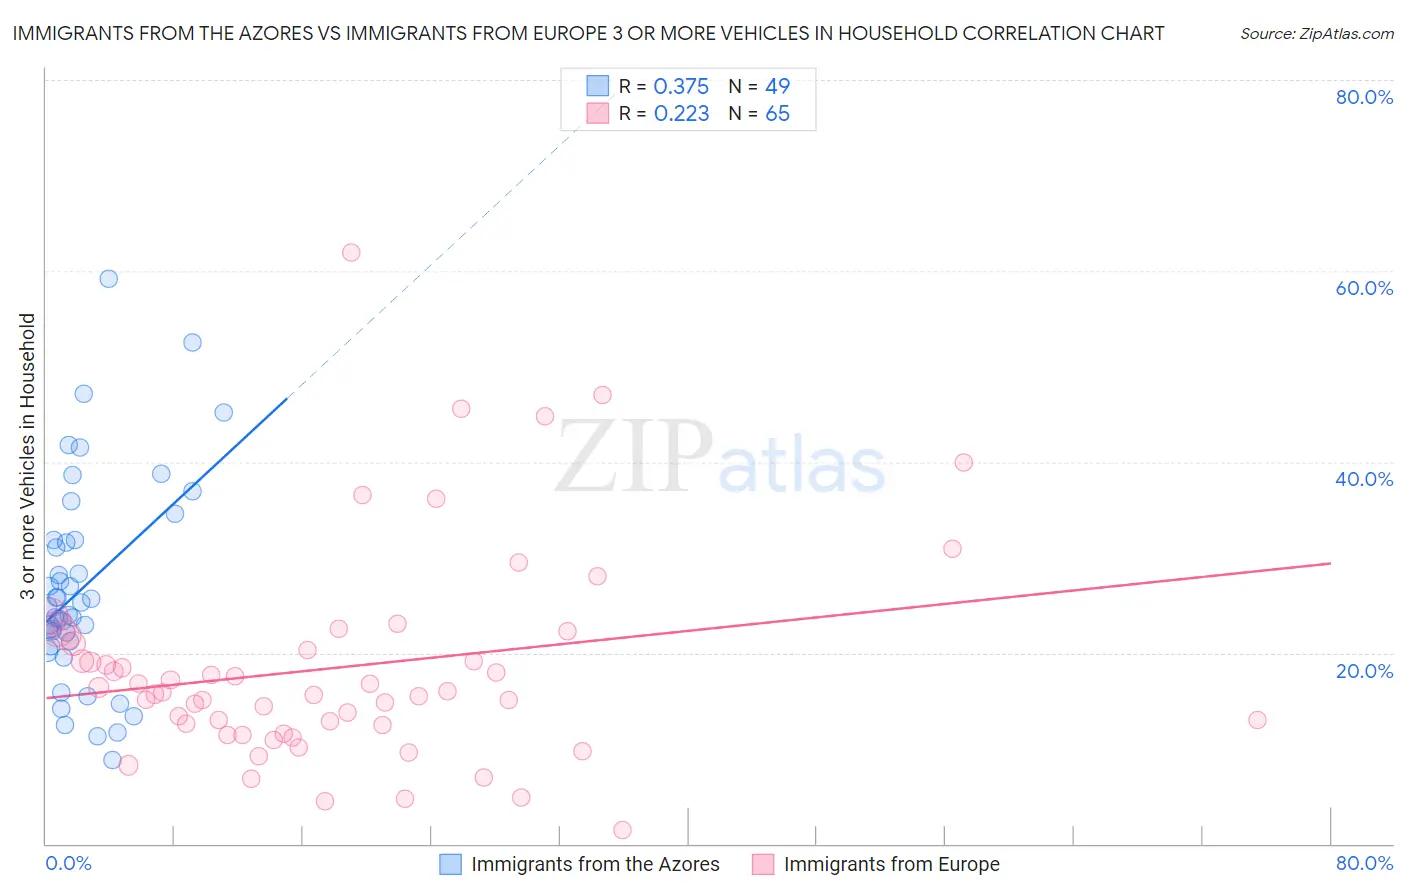
Immigrants from the Azores vs Immigrants from Europe 3 or more Vehicles in Household Correlation Chart
The statistical analysis conducted on geographies consisting of 46,257,310 people shows a mild positive correlation between the proportion of Immigrants from the Azores and percentage of households with 3 or more vehicles available in the United States with a correlation coefficient (R) of 0.375 and weighted average of 21.5%. Similarly, the statistical analysis conducted on geographies consisting of 546,637,785 people shows a weak positive correlation between the proportion of Immigrants from Europe and percentage of households with 3 or more vehicles available in the United States with a correlation coefficient (R) of 0.223 and weighted average of 18.1%, a difference of 18.4%.
3 or more Vehicles in Household Correlation Summary
| Measurement | Immigrants from the Azores | Immigrants from Europe |
| Minimum | 8.8% | 1.4% |
| Maximum | 59.2% | 61.9% |
| Range | 50.4% | 60.5% |
| Mean | 26.9% | 18.5% |
| Median | 24.9% | 15.9% |
| Interquartile 25% (IQ1) | 20.9% | 11.9% |
| Interquartile 75% (IQ3) | 31.8% | 21.4% |
| Interquartile Range (IQR) | 10.9% | 9.5% |
| Standard Deviation (Sample) | 10.8% | 11.1% |
| Standard Deviation (Population) | 10.7% | 11.0% |
Similar Demographics by 3 or more Vehicles in Household
Demographics Similar to Immigrants from the Azores by 3 or more Vehicles in Household
In terms of 3 or more vehicles in household, the demographic groups most similar to Immigrants from the Azores are Delaware (21.5%, a difference of 0.12%), Laotian (21.5%, a difference of 0.20%), Icelander (21.5%, a difference of 0.21%), Chippewa (21.5%, a difference of 0.26%), and French (21.4%, a difference of 0.26%).
| Demographics | Rating | Rank | 3 or more Vehicles in Household |
| Afghans | 99.7 /100 | #80 | Exceptional 21.7% |
| Celtics | 99.7 /100 | #81 | Exceptional 21.7% |
| Immigrants | El Salvador | 99.6 /100 | #82 | Exceptional 21.5% |
| Chippewa | 99.6 /100 | #83 | Exceptional 21.5% |
| Icelanders | 99.6 /100 | #84 | Exceptional 21.5% |
| Laotians | 99.6 /100 | #85 | Exceptional 21.5% |
| Delaware | 99.6 /100 | #86 | Exceptional 21.5% |
| Immigrants | Azores | 99.5 /100 | #87 | Exceptional 21.5% |
| French | 99.4 /100 | #88 | Exceptional 21.4% |
| Marshallese | 99.2 /100 | #89 | Exceptional 21.3% |
| Immigrants | Afghanistan | 99.1 /100 | #90 | Exceptional 21.2% |
| Belgians | 98.9 /100 | #91 | Exceptional 21.2% |
| Apache | 98.9 /100 | #92 | Exceptional 21.2% |
| Immigrants | Indonesia | 98.8 /100 | #93 | Exceptional 21.1% |
| Immigrants | Cambodia | 98.6 /100 | #94 | Exceptional 21.1% |
Demographics Similar to Immigrants from Europe by 3 or more Vehicles in Household
In terms of 3 or more vehicles in household, the demographic groups most similar to Immigrants from Europe are Hopi (18.2%, a difference of 0.12%), Mongolian (18.1%, a difference of 0.12%), African (18.2%, a difference of 0.23%), Immigrants from Belize (18.1%, a difference of 0.28%), and Immigrants from Australia (18.1%, a difference of 0.35%).
| Demographics | Rating | Rank | 3 or more Vehicles in Household |
| Immigrants | Malaysia | 3.6 /100 | #236 | Tragic 18.3% |
| Indonesians | 3.5 /100 | #237 | Tragic 18.3% |
| Immigrants | Honduras | 3.1 /100 | #238 | Tragic 18.2% |
| Immigrants | Middle Africa | 3.1 /100 | #239 | Tragic 18.2% |
| Immigrants | China | 2.9 /100 | #240 | Tragic 18.2% |
| Africans | 2.7 /100 | #241 | Tragic 18.2% |
| Hopi | 2.5 /100 | #242 | Tragic 18.2% |
| Immigrants | Europe | 2.4 /100 | #243 | Tragic 18.1% |
| Mongolians | 2.3 /100 | #244 | Tragic 18.1% |
| Immigrants | Belize | 2.1 /100 | #245 | Tragic 18.1% |
| Immigrants | Australia | 2.0 /100 | #246 | Tragic 18.1% |
| Carpatho Rusyns | 1.9 /100 | #247 | Tragic 18.0% |
| Immigrants | Eastern Africa | 1.8 /100 | #248 | Tragic 18.0% |
| Immigrants | Saudi Arabia | 1.7 /100 | #249 | Tragic 18.0% |
| Venezuelans | 1.7 /100 | #250 | Tragic 18.0% |