Romanian vs Immigrants from Europe 3 or more Vehicles in Household
COMPARE
Romanian
Immigrants from Europe
3 or more Vehicles in Household
3 or more Vehicles in Household Comparison
Romanians
Immigrants from Europe
19.3%
3 OR MORE VEHICLES IN HOUSEHOLD
37.1/ 100
METRIC RATING
181st/ 347
METRIC RANK
18.1%
3 OR MORE VEHICLES IN HOUSEHOLD
2.4/ 100
METRIC RATING
243rd/ 347
METRIC RANK
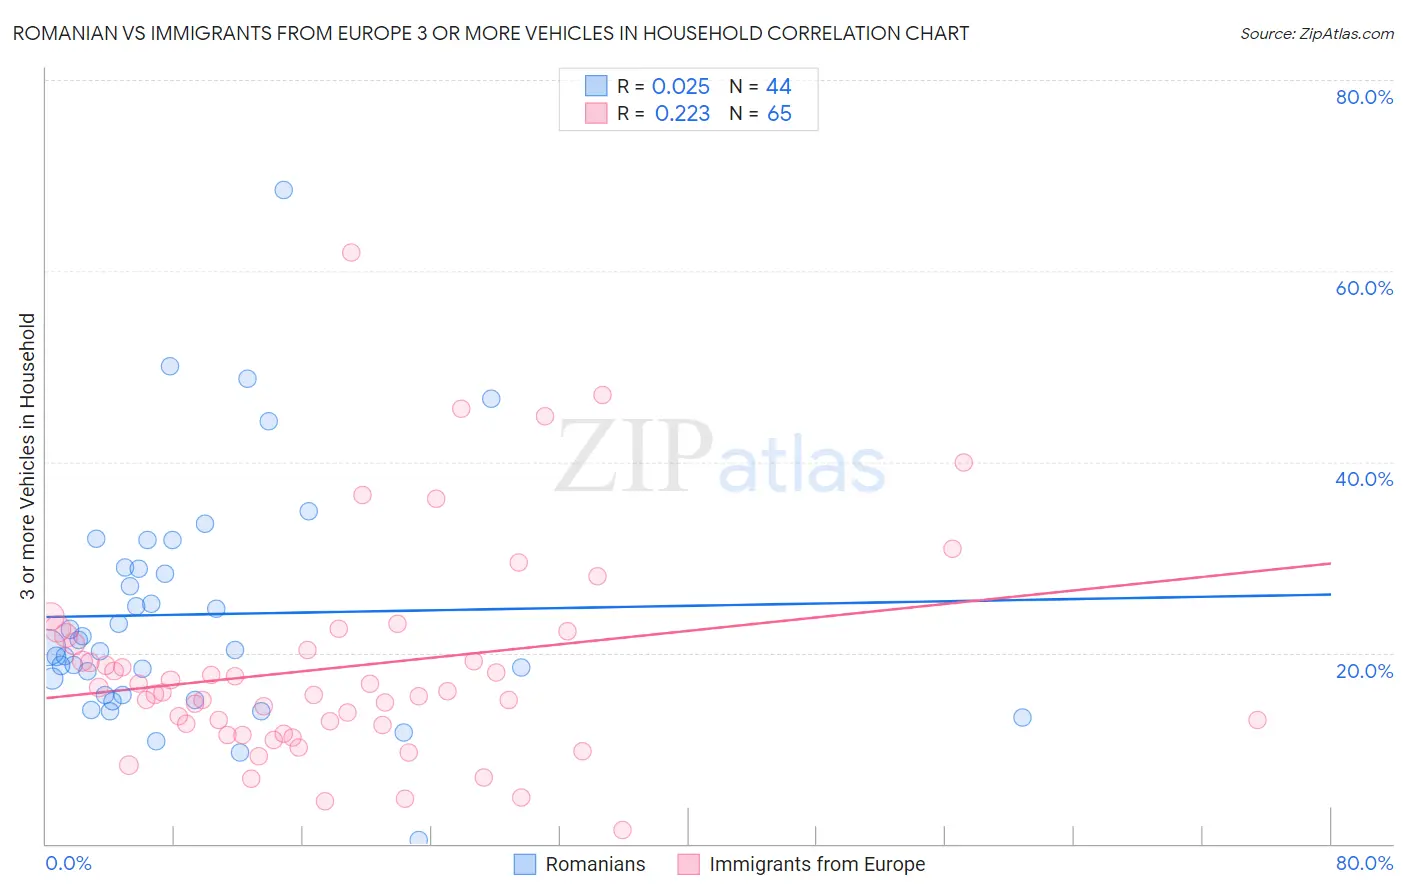
Romanian vs Immigrants from Europe 3 or more Vehicles in Household Correlation Chart
The statistical analysis conducted on geographies consisting of 377,618,048 people shows no correlation between the proportion of Romanians and percentage of households with 3 or more vehicles available in the United States with a correlation coefficient (R) of 0.025 and weighted average of 19.3%. Similarly, the statistical analysis conducted on geographies consisting of 546,637,785 people shows a weak positive correlation between the proportion of Immigrants from Europe and percentage of households with 3 or more vehicles available in the United States with a correlation coefficient (R) of 0.223 and weighted average of 18.1%, a difference of 6.5%.
3 or more Vehicles in Household Correlation Summary
| Measurement | Romanian | Immigrants from Europe |
| Minimum | 0.45% | 1.4% |
| Maximum | 68.5% | 61.9% |
| Range | 68.0% | 60.5% |
| Mean | 24.0% | 18.5% |
| Median | 20.5% | 15.9% |
| Interquartile 25% (IQ1) | 15.6% | 11.9% |
| Interquartile 75% (IQ3) | 28.9% | 21.4% |
| Interquartile Range (IQR) | 13.3% | 9.5% |
| Standard Deviation (Sample) | 12.5% | 11.1% |
| Standard Deviation (Population) | 12.4% | 11.0% |
Similar Demographics by 3 or more Vehicles in Household
Demographics Similar to Romanians by 3 or more Vehicles in Household
In terms of 3 or more vehicles in household, the demographic groups most similar to Romanians are South African (19.3%, a difference of 0.030%), Cuban (19.3%, a difference of 0.040%), Cajun (19.3%, a difference of 0.090%), Latvian (19.3%, a difference of 0.11%), and Immigrants from South Central Asia (19.3%, a difference of 0.15%).
| Demographics | Rating | Rank | 3 or more Vehicles in Household |
| Immigrants | South Africa | 50.0 /100 | #174 | Average 19.5% |
| Syrians | 47.0 /100 | #175 | Average 19.5% |
| Iroquois | 46.0 /100 | #176 | Average 19.4% |
| Immigrants | Peru | 41.1 /100 | #177 | Average 19.4% |
| Immigrants | Syria | 40.3 /100 | #178 | Average 19.4% |
| Immigrants | South Central Asia | 38.9 /100 | #179 | Fair 19.3% |
| South Africans | 37.5 /100 | #180 | Fair 19.3% |
| Romanians | 37.1 /100 | #181 | Fair 19.3% |
| Cubans | 36.6 /100 | #182 | Fair 19.3% |
| Cajuns | 36.0 /100 | #183 | Fair 19.3% |
| Latvians | 35.7 /100 | #184 | Fair 19.3% |
| Immigrants | Sri Lanka | 30.7 /100 | #185 | Fair 19.2% |
| Immigrants | Sweden | 29.0 /100 | #186 | Fair 19.2% |
| Immigrants | Hong Kong | 28.3 /100 | #187 | Fair 19.2% |
| Immigrants | Kuwait | 26.1 /100 | #188 | Fair 19.1% |
Demographics Similar to Immigrants from Europe by 3 or more Vehicles in Household
In terms of 3 or more vehicles in household, the demographic groups most similar to Immigrants from Europe are Hopi (18.2%, a difference of 0.12%), Mongolian (18.1%, a difference of 0.12%), African (18.2%, a difference of 0.23%), Immigrants from Belize (18.1%, a difference of 0.28%), and Immigrants from Australia (18.1%, a difference of 0.35%).
| Demographics | Rating | Rank | 3 or more Vehicles in Household |
| Immigrants | Malaysia | 3.6 /100 | #236 | Tragic 18.3% |
| Indonesians | 3.5 /100 | #237 | Tragic 18.3% |
| Immigrants | Honduras | 3.1 /100 | #238 | Tragic 18.2% |
| Immigrants | Middle Africa | 3.1 /100 | #239 | Tragic 18.2% |
| Immigrants | China | 2.9 /100 | #240 | Tragic 18.2% |
| Africans | 2.7 /100 | #241 | Tragic 18.2% |
| Hopi | 2.5 /100 | #242 | Tragic 18.2% |
| Immigrants | Europe | 2.4 /100 | #243 | Tragic 18.1% |
| Mongolians | 2.3 /100 | #244 | Tragic 18.1% |
| Immigrants | Belize | 2.1 /100 | #245 | Tragic 18.1% |
| Immigrants | Australia | 2.0 /100 | #246 | Tragic 18.1% |
| Carpatho Rusyns | 1.9 /100 | #247 | Tragic 18.0% |
| Immigrants | Eastern Africa | 1.8 /100 | #248 | Tragic 18.0% |
| Immigrants | Saudi Arabia | 1.7 /100 | #249 | Tragic 18.0% |
| Venezuelans | 1.7 /100 | #250 | Tragic 18.0% |