Lithuanian vs Immigrants from Northern Europe 3 or more Vehicles in Household
COMPARE
Lithuanian
Immigrants from Northern Europe
3 or more Vehicles in Household
3 or more Vehicles in Household Comparison
Lithuanians
Immigrants from Northern Europe
20.1%
3 OR MORE VEHICLES IN HOUSEHOLD
84.4/ 100
METRIC RATING
143rd/ 347
METRIC RANK
19.5%
3 OR MORE VEHICLES IN HOUSEHOLD
50.2/ 100
METRIC RATING
173rd/ 347
METRIC RANK
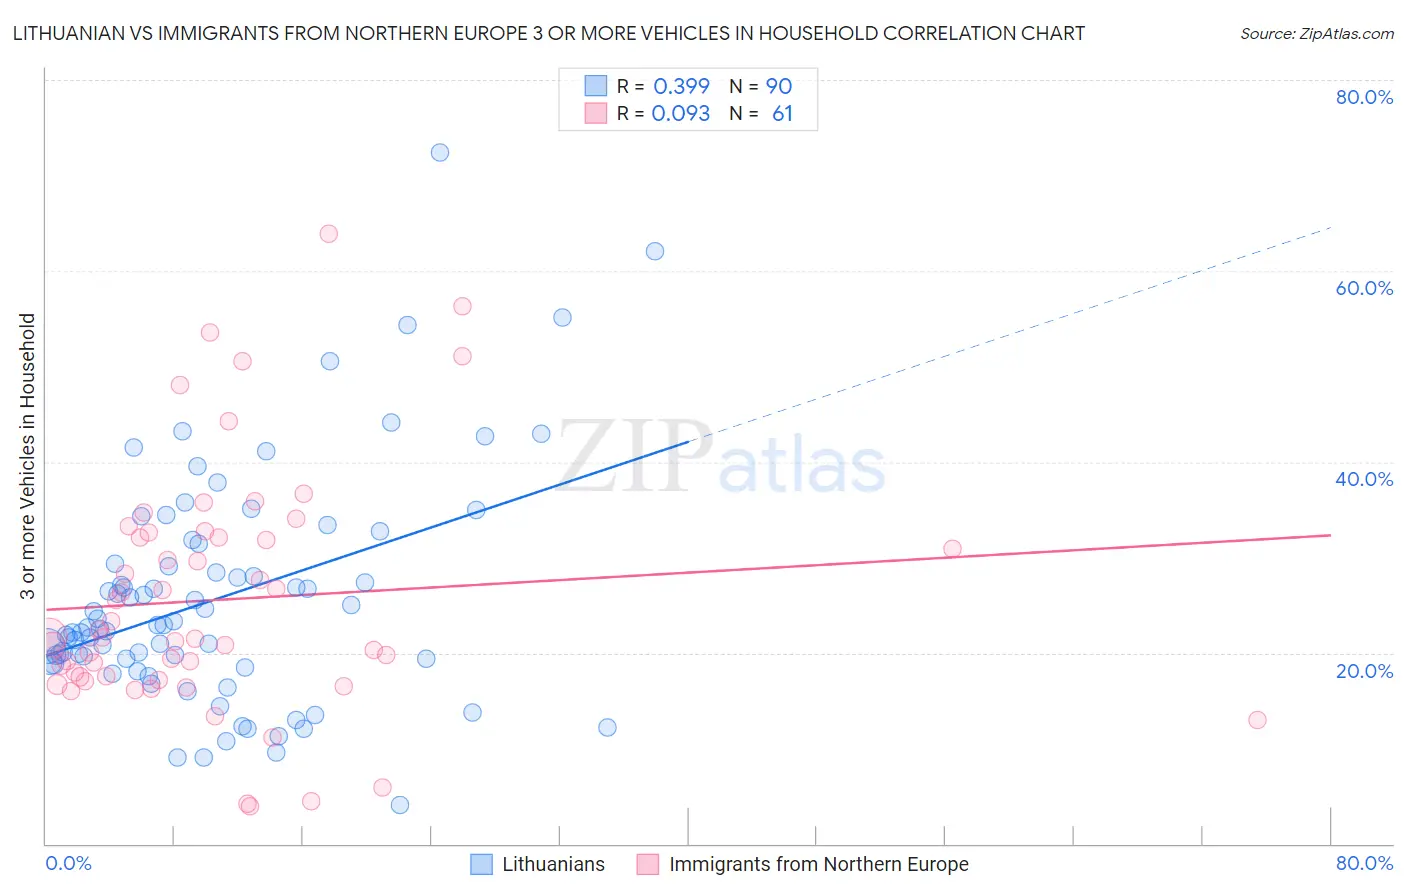
Lithuanian vs Immigrants from Northern Europe 3 or more Vehicles in Household Correlation Chart
The statistical analysis conducted on geographies consisting of 421,577,251 people shows a mild positive correlation between the proportion of Lithuanians and percentage of households with 3 or more vehicles available in the United States with a correlation coefficient (R) of 0.399 and weighted average of 20.1%. Similarly, the statistical analysis conducted on geographies consisting of 476,757,527 people shows a slight positive correlation between the proportion of Immigrants from Northern Europe and percentage of households with 3 or more vehicles available in the United States with a correlation coefficient (R) of 0.093 and weighted average of 19.5%, a difference of 3.2%.
3 or more Vehicles in Household Correlation Summary
| Measurement | Lithuanian | Immigrants from Northern Europe |
| Minimum | 4.1% | 3.9% |
| Maximum | 72.4% | 63.8% |
| Range | 68.4% | 59.9% |
| Mean | 25.6% | 25.6% |
| Median | 22.8% | 21.6% |
| Interquartile 25% (IQ1) | 19.0% | 17.3% |
| Interquartile 75% (IQ3) | 29.4% | 32.3% |
| Interquartile Range (IQR) | 10.4% | 15.0% |
| Standard Deviation (Sample) | 12.0% | 12.7% |
| Standard Deviation (Population) | 11.9% | 12.6% |
Similar Demographics by 3 or more Vehicles in Household
Demographics Similar to Lithuanians by 3 or more Vehicles in Household
In terms of 3 or more vehicles in household, the demographic groups most similar to Lithuanians are Jordanian (20.1%, a difference of 0.0%), Iranian (20.1%, a difference of 0.050%), Palestinian (20.1%, a difference of 0.060%), Ottawa (20.1%, a difference of 0.070%), and Australian (20.1%, a difference of 0.11%).
| Demographics | Rating | Rank | 3 or more Vehicles in Household |
| Immigrants | Nicaragua | 87.1 /100 | #136 | Excellent 20.2% |
| Immigrants | Iraq | 87.1 /100 | #137 | Excellent 20.2% |
| Aleuts | 86.3 /100 | #138 | Excellent 20.2% |
| Slovenes | 85.5 /100 | #139 | Excellent 20.2% |
| French American Indians | 85.3 /100 | #140 | Excellent 20.1% |
| Ottawa | 84.9 /100 | #141 | Excellent 20.1% |
| Jordanians | 84.4 /100 | #142 | Excellent 20.1% |
| Lithuanians | 84.4 /100 | #143 | Excellent 20.1% |
| Iranians | 84.0 /100 | #144 | Excellent 20.1% |
| Palestinians | 83.9 /100 | #145 | Excellent 20.1% |
| Australians | 83.6 /100 | #146 | Excellent 20.1% |
| Slovaks | 83.0 /100 | #147 | Excellent 20.1% |
| Guatemalans | 82.6 /100 | #148 | Excellent 20.1% |
| Immigrants | Iran | 80.9 /100 | #149 | Excellent 20.0% |
| Immigrants | Immigrants | 80.8 /100 | #150 | Excellent 20.0% |
Demographics Similar to Immigrants from Northern Europe by 3 or more Vehicles in Household
In terms of 3 or more vehicles in household, the demographic groups most similar to Immigrants from Northern Europe are Immigrants from South Africa (19.5%, a difference of 0.020%), Kiowa (19.5%, a difference of 0.050%), Immigrants from Western Europe (19.5%, a difference of 0.23%), Syrian (19.5%, a difference of 0.25%), and Iroquois (19.4%, a difference of 0.32%).
| Demographics | Rating | Rank | 3 or more Vehicles in Household |
| Immigrants | Cameroon | 60.9 /100 | #166 | Good 19.7% |
| Ukrainians | 58.9 /100 | #167 | Average 19.6% |
| Peruvians | 58.8 /100 | #168 | Average 19.6% |
| Immigrants | Denmark | 57.6 /100 | #169 | Average 19.6% |
| Iraqis | 56.0 /100 | #170 | Average 19.6% |
| Immigrants | Western Europe | 53.2 /100 | #171 | Average 19.5% |
| Kiowa | 50.9 /100 | #172 | Average 19.5% |
| Immigrants | Northern Europe | 50.2 /100 | #173 | Average 19.5% |
| Immigrants | South Africa | 50.0 /100 | #174 | Average 19.5% |
| Syrians | 47.0 /100 | #175 | Average 19.5% |
| Iroquois | 46.0 /100 | #176 | Average 19.4% |
| Immigrants | Peru | 41.1 /100 | #177 | Average 19.4% |
| Immigrants | Syria | 40.3 /100 | #178 | Average 19.4% |
| Immigrants | South Central Asia | 38.9 /100 | #179 | Fair 19.3% |
| South Africans | 37.5 /100 | #180 | Fair 19.3% |