Lithuanian vs Delaware 3 or more Vehicles in Household
COMPARE
Lithuanian
Delaware
3 or more Vehicles in Household
3 or more Vehicles in Household Comparison
Lithuanians
Delaware
20.1%
3 OR MORE VEHICLES IN HOUSEHOLD
84.4/ 100
METRIC RATING
143rd/ 347
METRIC RANK
21.5%
3 OR MORE VEHICLES IN HOUSEHOLD
99.6/ 100
METRIC RATING
86th/ 347
METRIC RANK
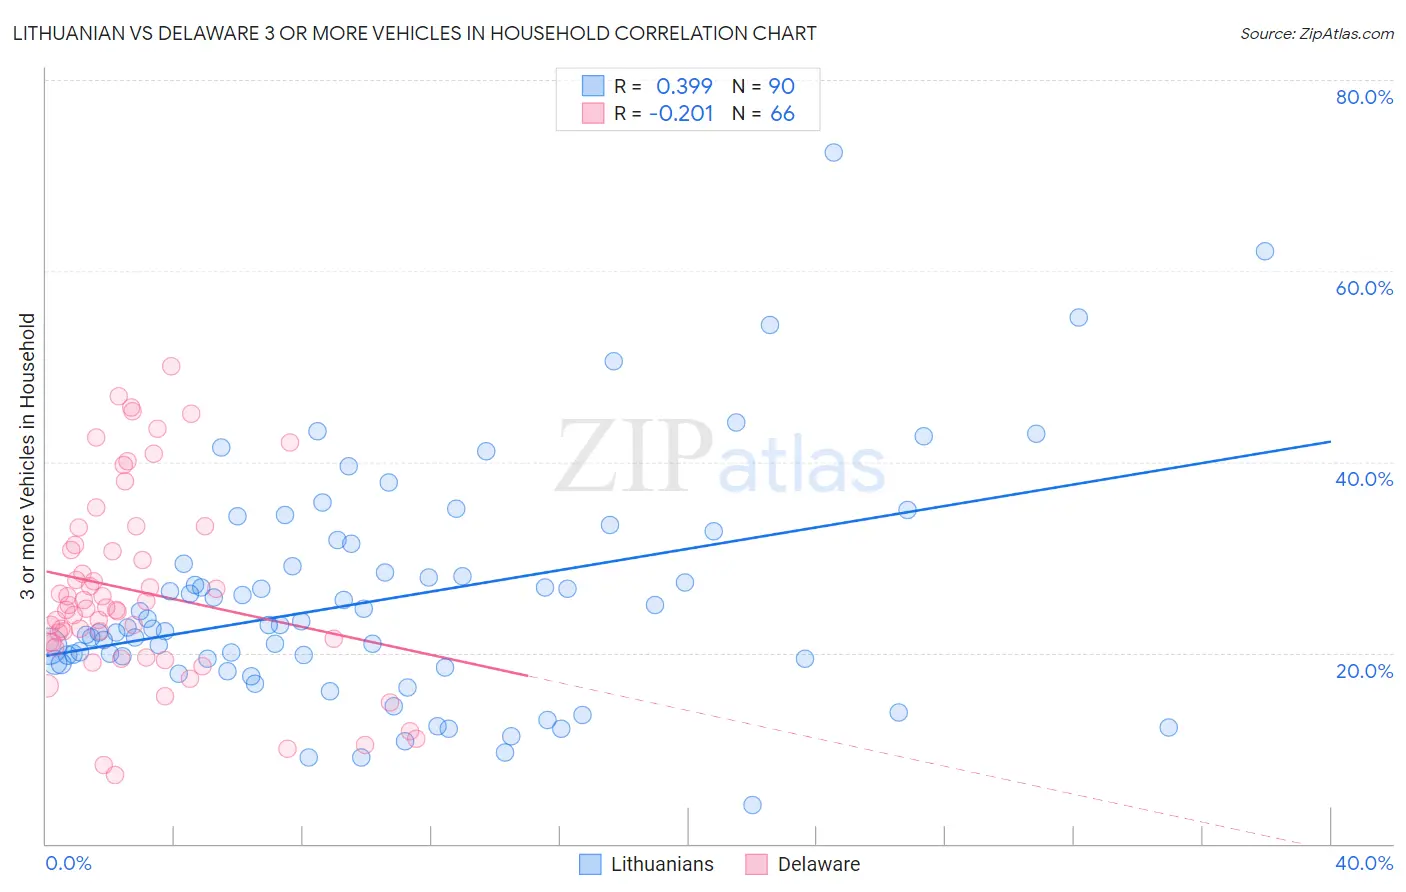
Lithuanian vs Delaware 3 or more Vehicles in Household Correlation Chart
The statistical analysis conducted on geographies consisting of 421,577,251 people shows a mild positive correlation between the proportion of Lithuanians and percentage of households with 3 or more vehicles available in the United States with a correlation coefficient (R) of 0.399 and weighted average of 20.1%. Similarly, the statistical analysis conducted on geographies consisting of 96,224,171 people shows a weak negative correlation between the proportion of Delaware and percentage of households with 3 or more vehicles available in the United States with a correlation coefficient (R) of -0.201 and weighted average of 21.5%, a difference of 6.8%.
3 or more Vehicles in Household Correlation Summary
| Measurement | Lithuanian | Delaware |
| Minimum | 4.1% | 7.2% |
| Maximum | 72.4% | 50.0% |
| Range | 68.4% | 42.8% |
| Mean | 25.6% | 26.5% |
| Median | 22.8% | 24.7% |
| Interquartile 25% (IQ1) | 19.0% | 21.1% |
| Interquartile 75% (IQ3) | 29.4% | 31.3% |
| Interquartile Range (IQR) | 10.4% | 10.1% |
| Standard Deviation (Sample) | 12.0% | 10.0% |
| Standard Deviation (Population) | 11.9% | 9.9% |
Similar Demographics by 3 or more Vehicles in Household
Demographics Similar to Lithuanians by 3 or more Vehicles in Household
In terms of 3 or more vehicles in household, the demographic groups most similar to Lithuanians are Jordanian (20.1%, a difference of 0.0%), Iranian (20.1%, a difference of 0.050%), Palestinian (20.1%, a difference of 0.060%), Ottawa (20.1%, a difference of 0.070%), and Australian (20.1%, a difference of 0.11%).
| Demographics | Rating | Rank | 3 or more Vehicles in Household |
| Immigrants | Nicaragua | 87.1 /100 | #136 | Excellent 20.2% |
| Immigrants | Iraq | 87.1 /100 | #137 | Excellent 20.2% |
| Aleuts | 86.3 /100 | #138 | Excellent 20.2% |
| Slovenes | 85.5 /100 | #139 | Excellent 20.2% |
| French American Indians | 85.3 /100 | #140 | Excellent 20.1% |
| Ottawa | 84.9 /100 | #141 | Excellent 20.1% |
| Jordanians | 84.4 /100 | #142 | Excellent 20.1% |
| Lithuanians | 84.4 /100 | #143 | Excellent 20.1% |
| Iranians | 84.0 /100 | #144 | Excellent 20.1% |
| Palestinians | 83.9 /100 | #145 | Excellent 20.1% |
| Australians | 83.6 /100 | #146 | Excellent 20.1% |
| Slovaks | 83.0 /100 | #147 | Excellent 20.1% |
| Guatemalans | 82.6 /100 | #148 | Excellent 20.1% |
| Immigrants | Iran | 80.9 /100 | #149 | Excellent 20.0% |
| Immigrants | Immigrants | 80.8 /100 | #150 | Excellent 20.0% |
Demographics Similar to Delaware by 3 or more Vehicles in Household
In terms of 3 or more vehicles in household, the demographic groups most similar to Delaware are Laotian (21.5%, a difference of 0.080%), Icelander (21.5%, a difference of 0.090%), Immigrants from the Azores (21.5%, a difference of 0.12%), Chippewa (21.5%, a difference of 0.14%), and Immigrants from El Salvador (21.5%, a difference of 0.17%).
| Demographics | Rating | Rank | 3 or more Vehicles in Household |
| Assyrians/Chaldeans/Syriacs | 99.8 /100 | #79 | Exceptional 21.7% |
| Afghans | 99.7 /100 | #80 | Exceptional 21.7% |
| Celtics | 99.7 /100 | #81 | Exceptional 21.7% |
| Immigrants | El Salvador | 99.6 /100 | #82 | Exceptional 21.5% |
| Chippewa | 99.6 /100 | #83 | Exceptional 21.5% |
| Icelanders | 99.6 /100 | #84 | Exceptional 21.5% |
| Laotians | 99.6 /100 | #85 | Exceptional 21.5% |
| Delaware | 99.6 /100 | #86 | Exceptional 21.5% |
| Immigrants | Azores | 99.5 /100 | #87 | Exceptional 21.5% |
| French | 99.4 /100 | #88 | Exceptional 21.4% |
| Marshallese | 99.2 /100 | #89 | Exceptional 21.3% |
| Immigrants | Afghanistan | 99.1 /100 | #90 | Exceptional 21.2% |
| Belgians | 98.9 /100 | #91 | Exceptional 21.2% |
| Apache | 98.9 /100 | #92 | Exceptional 21.2% |
| Immigrants | Indonesia | 98.8 /100 | #93 | Exceptional 21.1% |