Lithuanian vs Immigrants from Europe Bachelor's Degree
COMPARE
Lithuanian
Immigrants from Europe
Bachelor's Degree
Bachelor's Degree Comparison
Lithuanians
Immigrants from Europe
42.2%
BACHELOR'S DEGREE
99.2/ 100
METRIC RATING
85th/ 347
METRIC RANK
43.4%
BACHELOR'S DEGREE
99.8/ 100
METRIC RATING
63rd/ 347
METRIC RANK
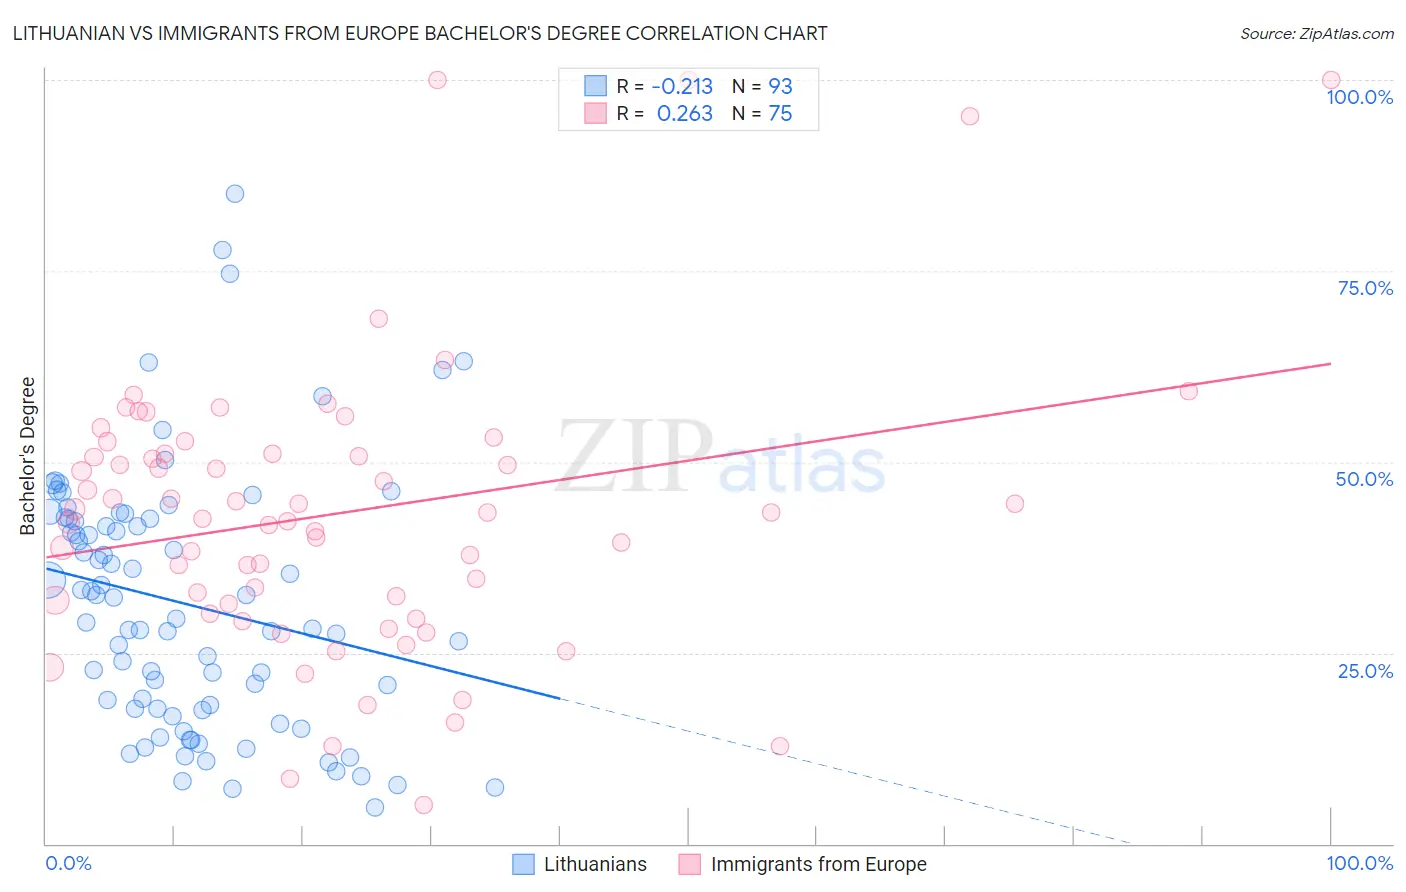
Lithuanian vs Immigrants from Europe Bachelor's Degree Correlation Chart
The statistical analysis conducted on geographies consisting of 421,915,203 people shows a weak negative correlation between the proportion of Lithuanians and percentage of population with at least bachelor's degree education in the United States with a correlation coefficient (R) of -0.213 and weighted average of 42.2%. Similarly, the statistical analysis conducted on geographies consisting of 547,335,067 people shows a weak positive correlation between the proportion of Immigrants from Europe and percentage of population with at least bachelor's degree education in the United States with a correlation coefficient (R) of 0.263 and weighted average of 43.4%, a difference of 2.7%.
Bachelor's Degree Correlation Summary
| Measurement | Lithuanian | Immigrants from Europe |
| Minimum | 4.7% | 5.0% |
| Maximum | 85.2% | 100.0% |
| Range | 80.5% | 95.0% |
| Mean | 31.4% | 43.3% |
| Median | 29.4% | 43.3% |
| Interquartile 25% (IQ1) | 17.6% | 31.4% |
| Interquartile 75% (IQ3) | 42.5% | 51.1% |
| Interquartile Range (IQR) | 25.0% | 19.6% |
| Standard Deviation (Sample) | 16.9% | 18.9% |
| Standard Deviation (Population) | 16.8% | 18.8% |
Similar Demographics by Bachelor's Degree
Demographics Similar to Lithuanians by Bachelor's Degree
In terms of bachelor's degree, the demographic groups most similar to Lithuanians are Immigrants from Western Asia (42.3%, a difference of 0.030%), Armenian (42.3%, a difference of 0.040%), Immigrants from Scotland (42.3%, a difference of 0.070%), Immigrants from Brazil (42.2%, a difference of 0.080%), and Immigrants from Hungary (42.3%, a difference of 0.14%).
| Demographics | Rating | Rank | Bachelor's Degree |
| Immigrants | Ethiopia | 99.4 /100 | #78 | Exceptional 42.5% |
| Immigrants | Lebanon | 99.3 /100 | #79 | Exceptional 42.4% |
| Immigrants | Croatia | 99.2 /100 | #80 | Exceptional 42.3% |
| Immigrants | Hungary | 99.2 /100 | #81 | Exceptional 42.3% |
| Immigrants | Scotland | 99.2 /100 | #82 | Exceptional 42.3% |
| Armenians | 99.2 /100 | #83 | Exceptional 42.3% |
| Immigrants | Western Asia | 99.2 /100 | #84 | Exceptional 42.3% |
| Lithuanians | 99.2 /100 | #85 | Exceptional 42.2% |
| Immigrants | Brazil | 99.2 /100 | #86 | Exceptional 42.2% |
| Carpatho Rusyns | 99.0 /100 | #87 | Exceptional 42.1% |
| Immigrants | Western Europe | 99.0 /100 | #88 | Exceptional 42.0% |
| Greeks | 99.0 /100 | #89 | Exceptional 42.0% |
| Laotians | 98.9 /100 | #90 | Exceptional 42.0% |
| Immigrants | Northern Africa | 98.9 /100 | #91 | Exceptional 41.9% |
| Maltese | 98.8 /100 | #92 | Exceptional 41.9% |
Demographics Similar to Immigrants from Europe by Bachelor's Degree
In terms of bachelor's degree, the demographic groups most similar to Immigrants from Europe are Immigrants from Kazakhstan (43.4%, a difference of 0.050%), Argentinean (43.3%, a difference of 0.27%), Zimbabwean (43.3%, a difference of 0.28%), Immigrants from Netherlands (43.3%, a difference of 0.30%), and Egyptian (43.3%, a difference of 0.32%).
| Demographics | Rating | Rank | Bachelor's Degree |
| Immigrants | Serbia | 99.9 /100 | #56 | Exceptional 44.1% |
| Paraguayans | 99.9 /100 | #57 | Exceptional 44.0% |
| Immigrants | Czechoslovakia | 99.9 /100 | #58 | Exceptional 44.0% |
| Australians | 99.9 /100 | #59 | Exceptional 44.0% |
| New Zealanders | 99.9 /100 | #60 | Exceptional 44.0% |
| South Africans | 99.8 /100 | #61 | Exceptional 43.6% |
| Immigrants | Kazakhstan | 99.8 /100 | #62 | Exceptional 43.4% |
| Immigrants | Europe | 99.8 /100 | #63 | Exceptional 43.4% |
| Argentineans | 99.7 /100 | #64 | Exceptional 43.3% |
| Zimbabweans | 99.7 /100 | #65 | Exceptional 43.3% |
| Immigrants | Netherlands | 99.7 /100 | #66 | Exceptional 43.3% |
| Egyptians | 99.7 /100 | #67 | Exceptional 43.3% |
| Immigrants | Indonesia | 99.7 /100 | #68 | Exceptional 43.3% |
| Immigrants | Pakistan | 99.7 /100 | #69 | Exceptional 43.1% |
| Immigrants | Romania | 99.6 /100 | #70 | Exceptional 42.9% |