Lithuanian vs Immigrants from Sri Lanka 3 or more Vehicles in Household
COMPARE
Lithuanian
Immigrants from Sri Lanka
3 or more Vehicles in Household
3 or more Vehicles in Household Comparison
Lithuanians
Immigrants from Sri Lanka
20.1%
3 OR MORE VEHICLES IN HOUSEHOLD
84.4/ 100
METRIC RATING
143rd/ 347
METRIC RANK
19.2%
3 OR MORE VEHICLES IN HOUSEHOLD
30.7/ 100
METRIC RATING
185th/ 347
METRIC RANK
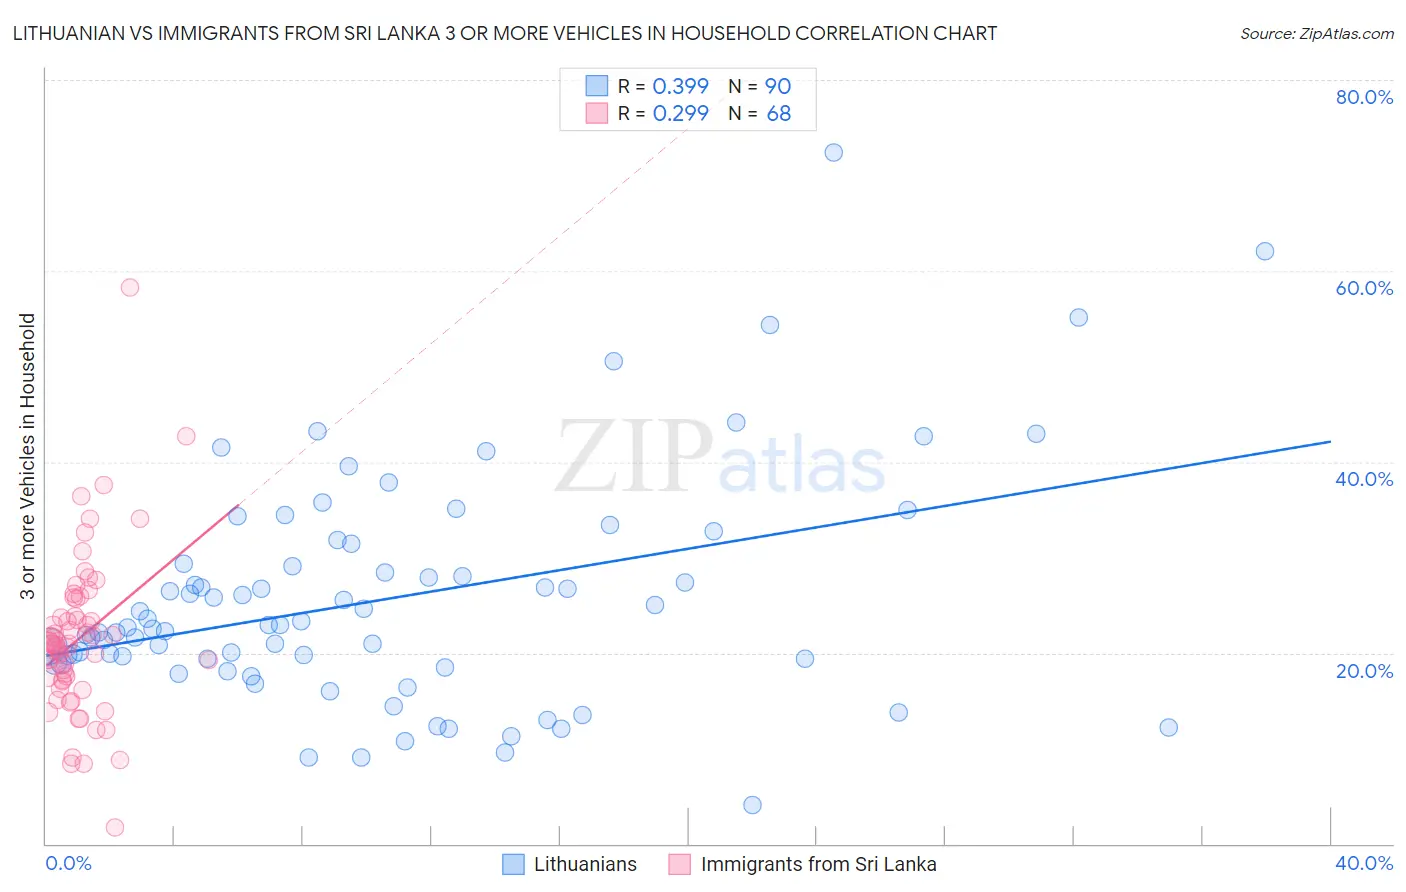
Lithuanian vs Immigrants from Sri Lanka 3 or more Vehicles in Household Correlation Chart
The statistical analysis conducted on geographies consisting of 421,577,251 people shows a mild positive correlation between the proportion of Lithuanians and percentage of households with 3 or more vehicles available in the United States with a correlation coefficient (R) of 0.399 and weighted average of 20.1%. Similarly, the statistical analysis conducted on geographies consisting of 149,676,246 people shows a weak positive correlation between the proportion of Immigrants from Sri Lanka and percentage of households with 3 or more vehicles available in the United States with a correlation coefficient (R) of 0.299 and weighted average of 19.2%, a difference of 4.8%.
3 or more Vehicles in Household Correlation Summary
| Measurement | Lithuanian | Immigrants from Sri Lanka |
| Minimum | 4.1% | 1.7% |
| Maximum | 72.4% | 58.3% |
| Range | 68.4% | 56.6% |
| Mean | 25.6% | 21.5% |
| Median | 22.8% | 20.9% |
| Interquartile 25% (IQ1) | 19.0% | 17.0% |
| Interquartile 75% (IQ3) | 29.4% | 24.8% |
| Interquartile Range (IQR) | 10.4% | 7.7% |
| Standard Deviation (Sample) | 12.0% | 8.6% |
| Standard Deviation (Population) | 11.9% | 8.5% |
Similar Demographics by 3 or more Vehicles in Household
Demographics Similar to Lithuanians by 3 or more Vehicles in Household
In terms of 3 or more vehicles in household, the demographic groups most similar to Lithuanians are Jordanian (20.1%, a difference of 0.0%), Iranian (20.1%, a difference of 0.050%), Palestinian (20.1%, a difference of 0.060%), Ottawa (20.1%, a difference of 0.070%), and Australian (20.1%, a difference of 0.11%).
| Demographics | Rating | Rank | 3 or more Vehicles in Household |
| Immigrants | Nicaragua | 87.1 /100 | #136 | Excellent 20.2% |
| Immigrants | Iraq | 87.1 /100 | #137 | Excellent 20.2% |
| Aleuts | 86.3 /100 | #138 | Excellent 20.2% |
| Slovenes | 85.5 /100 | #139 | Excellent 20.2% |
| French American Indians | 85.3 /100 | #140 | Excellent 20.1% |
| Ottawa | 84.9 /100 | #141 | Excellent 20.1% |
| Jordanians | 84.4 /100 | #142 | Excellent 20.1% |
| Lithuanians | 84.4 /100 | #143 | Excellent 20.1% |
| Iranians | 84.0 /100 | #144 | Excellent 20.1% |
| Palestinians | 83.9 /100 | #145 | Excellent 20.1% |
| Australians | 83.6 /100 | #146 | Excellent 20.1% |
| Slovaks | 83.0 /100 | #147 | Excellent 20.1% |
| Guatemalans | 82.6 /100 | #148 | Excellent 20.1% |
| Immigrants | Iran | 80.9 /100 | #149 | Excellent 20.0% |
| Immigrants | Immigrants | 80.8 /100 | #150 | Excellent 20.0% |
Demographics Similar to Immigrants from Sri Lanka by 3 or more Vehicles in Household
In terms of 3 or more vehicles in household, the demographic groups most similar to Immigrants from Sri Lanka are Immigrants from Sweden (19.2%, a difference of 0.16%), Immigrants from Hong Kong (19.2%, a difference of 0.22%), Latvian (19.3%, a difference of 0.44%), Immigrants from Kuwait (19.1%, a difference of 0.44%), and Indian (Asian) (19.1%, a difference of 0.44%).
| Demographics | Rating | Rank | 3 or more Vehicles in Household |
| Immigrants | Syria | 40.3 /100 | #178 | Average 19.4% |
| Immigrants | South Central Asia | 38.9 /100 | #179 | Fair 19.3% |
| South Africans | 37.5 /100 | #180 | Fair 19.3% |
| Romanians | 37.1 /100 | #181 | Fair 19.3% |
| Cubans | 36.6 /100 | #182 | Fair 19.3% |
| Cajuns | 36.0 /100 | #183 | Fair 19.3% |
| Latvians | 35.7 /100 | #184 | Fair 19.3% |
| Immigrants | Sri Lanka | 30.7 /100 | #185 | Fair 19.2% |
| Immigrants | Sweden | 29.0 /100 | #186 | Fair 19.2% |
| Immigrants | Hong Kong | 28.3 /100 | #187 | Fair 19.2% |
| Immigrants | Kuwait | 26.1 /100 | #188 | Fair 19.1% |
| Indians (Asian) | 26.0 /100 | #189 | Fair 19.1% |
| Immigrants | Zimbabwe | 25.5 /100 | #190 | Fair 19.1% |
| South American Indians | 25.4 /100 | #191 | Fair 19.1% |
| Kenyans | 24.7 /100 | #192 | Fair 19.1% |