Immigrants from Micronesia vs Immigrants from Costa Rica 3 or more Vehicles in Household
COMPARE
Immigrants from Micronesia
Immigrants from Costa Rica
3 or more Vehicles in Household
3 or more Vehicles in Household Comparison
Immigrants from Micronesia
Immigrants from Costa Rica
20.7%
3 OR MORE VEHICLES IN HOUSEHOLD
96.7/ 100
METRIC RATING
111th/ 347
METRIC RANK
19.7%
3 OR MORE VEHICLES IN HOUSEHOLD
61.9/ 100
METRIC RATING
165th/ 347
METRIC RANK
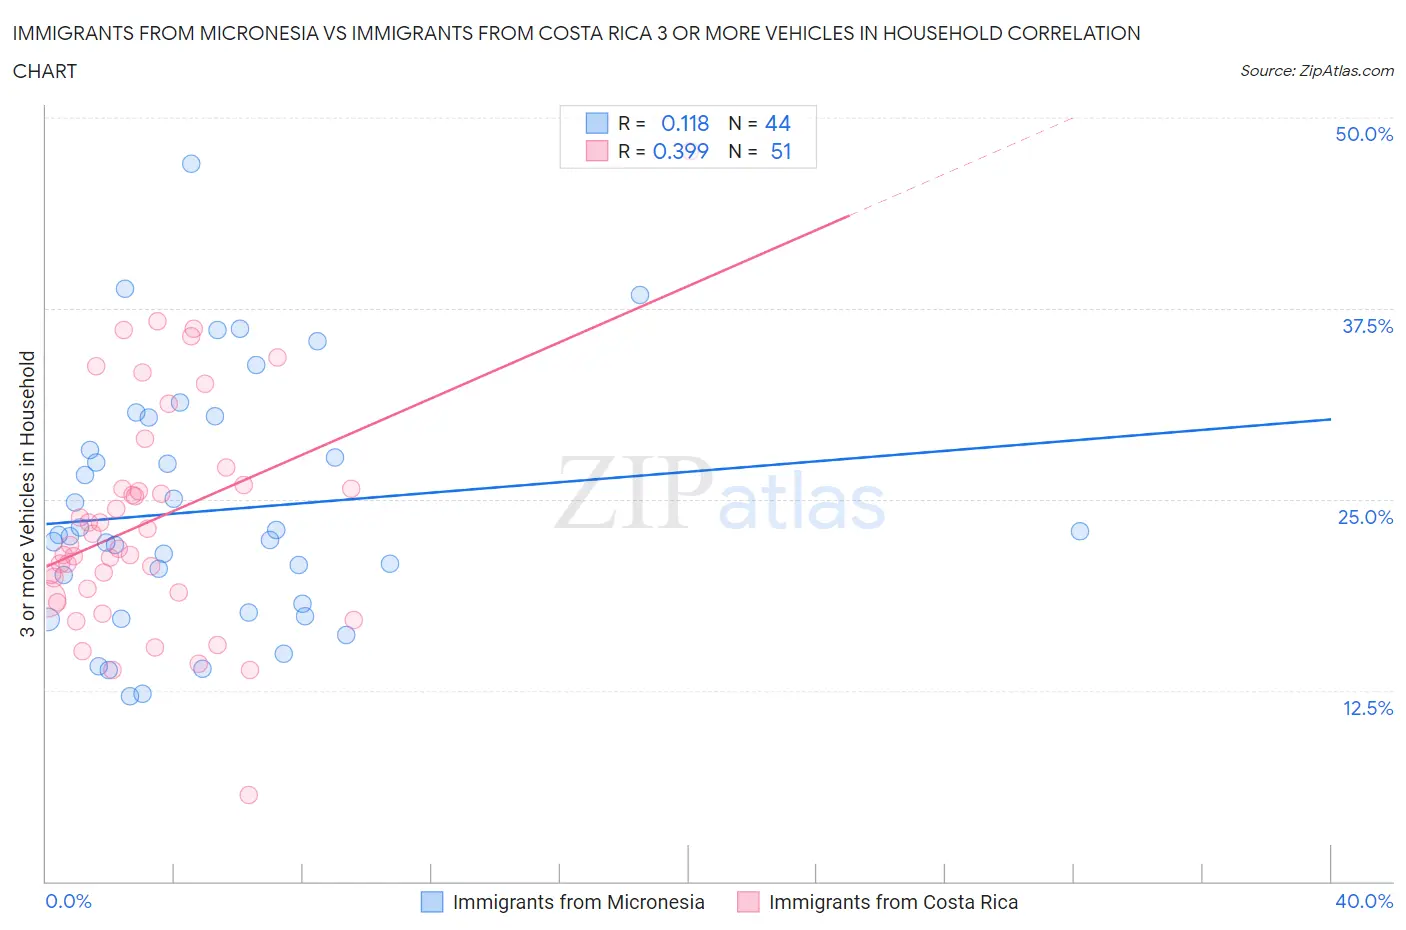
Immigrants from Micronesia vs Immigrants from Costa Rica 3 or more Vehicles in Household Correlation Chart
The statistical analysis conducted on geographies consisting of 61,601,070 people shows a poor positive correlation between the proportion of Immigrants from Micronesia and percentage of households with 3 or more vehicles available in the United States with a correlation coefficient (R) of 0.118 and weighted average of 20.7%. Similarly, the statistical analysis conducted on geographies consisting of 204,232,387 people shows a mild positive correlation between the proportion of Immigrants from Costa Rica and percentage of households with 3 or more vehicles available in the United States with a correlation coefficient (R) of 0.399 and weighted average of 19.7%, a difference of 5.4%.
3 or more Vehicles in Household Correlation Summary
| Measurement | Immigrants from Micronesia | Immigrants from Costa Rica |
| Minimum | 12.1% | 5.6% |
| Maximum | 47.0% | 47.8% |
| Range | 34.8% | 42.2% |
| Mean | 24.2% | 23.6% |
| Median | 22.6% | 22.0% |
| Interquartile 25% (IQ1) | 17.9% | 18.9% |
| Interquartile 75% (IQ3) | 29.3% | 26.0% |
| Interquartile Range (IQR) | 11.4% | 7.0% |
| Standard Deviation (Sample) | 8.0% | 7.6% |
| Standard Deviation (Population) | 7.9% | 7.5% |
Similar Demographics by 3 or more Vehicles in Household
Demographics Similar to Immigrants from Micronesia by 3 or more Vehicles in Household
In terms of 3 or more vehicles in household, the demographic groups most similar to Immigrants from Micronesia are Asian (20.8%, a difference of 0.030%), Filipino (20.8%, a difference of 0.17%), Immigrants from Scotland (20.8%, a difference of 0.23%), Nicaraguan (20.7%, a difference of 0.29%), and Immigrants from England (20.7%, a difference of 0.30%).
| Demographics | Rating | Rank | 3 or more Vehicles in Household |
| Luxembourgers | 97.7 /100 | #104 | Exceptional 20.9% |
| Austrians | 97.5 /100 | #105 | Exceptional 20.9% |
| Bolivians | 97.4 /100 | #106 | Exceptional 20.8% |
| Immigrants | Germany | 97.4 /100 | #107 | Exceptional 20.8% |
| Immigrants | Scotland | 97.1 /100 | #108 | Exceptional 20.8% |
| Filipinos | 97.0 /100 | #109 | Exceptional 20.8% |
| Asians | 96.8 /100 | #110 | Exceptional 20.8% |
| Immigrants | Micronesia | 96.7 /100 | #111 | Exceptional 20.7% |
| Nicaraguans | 96.2 /100 | #112 | Exceptional 20.7% |
| Immigrants | England | 96.2 /100 | #113 | Exceptional 20.7% |
| Burmese | 95.8 /100 | #114 | Exceptional 20.6% |
| French Canadians | 95.0 /100 | #115 | Exceptional 20.6% |
| Italians | 94.9 /100 | #116 | Exceptional 20.6% |
| Croatians | 94.9 /100 | #117 | Exceptional 20.6% |
| Costa Ricans | 94.6 /100 | #118 | Exceptional 20.6% |
Demographics Similar to Immigrants from Costa Rica by 3 or more Vehicles in Household
In terms of 3 or more vehicles in household, the demographic groups most similar to Immigrants from Costa Rica are Yugoslavian (19.7%, a difference of 0.080%), Immigrants from Cameroon (19.7%, a difference of 0.080%), Chilean (19.7%, a difference of 0.090%), Estonian (19.7%, a difference of 0.11%), and Ukrainian (19.6%, a difference of 0.24%).
| Demographics | Rating | Rank | 3 or more Vehicles in Household |
| Armenians | 68.8 /100 | #158 | Good 19.8% |
| Immigrants | Pakistan | 68.2 /100 | #159 | Good 19.8% |
| Immigrants | Lebanon | 67.6 /100 | #160 | Good 19.8% |
| Immigrants | Guatemala | 65.6 /100 | #161 | Good 19.7% |
| Estonians | 63.2 /100 | #162 | Good 19.7% |
| Chileans | 63.0 /100 | #163 | Good 19.7% |
| Yugoslavians | 62.9 /100 | #164 | Good 19.7% |
| Immigrants | Costa Rica | 61.9 /100 | #165 | Good 19.7% |
| Immigrants | Cameroon | 60.9 /100 | #166 | Good 19.7% |
| Ukrainians | 58.9 /100 | #167 | Average 19.6% |
| Peruvians | 58.8 /100 | #168 | Average 19.6% |
| Immigrants | Denmark | 57.6 /100 | #169 | Average 19.6% |
| Iraqis | 56.0 /100 | #170 | Average 19.6% |
| Immigrants | Western Europe | 53.2 /100 | #171 | Average 19.5% |
| Kiowa | 50.9 /100 | #172 | Average 19.5% |