White/Caucasian vs Immigrants from Costa Rica 3 or more Vehicles in Household
COMPARE
White/Caucasian
Immigrants from Costa Rica
3 or more Vehicles in Household
3 or more Vehicles in Household Comparison
Whites/Caucasians
Immigrants from Costa Rica
22.6%
3 OR MORE VEHICLES IN HOUSEHOLD
100.0/ 100
METRIC RATING
51st/ 347
METRIC RANK
19.7%
3 OR MORE VEHICLES IN HOUSEHOLD
61.9/ 100
METRIC RATING
165th/ 347
METRIC RANK
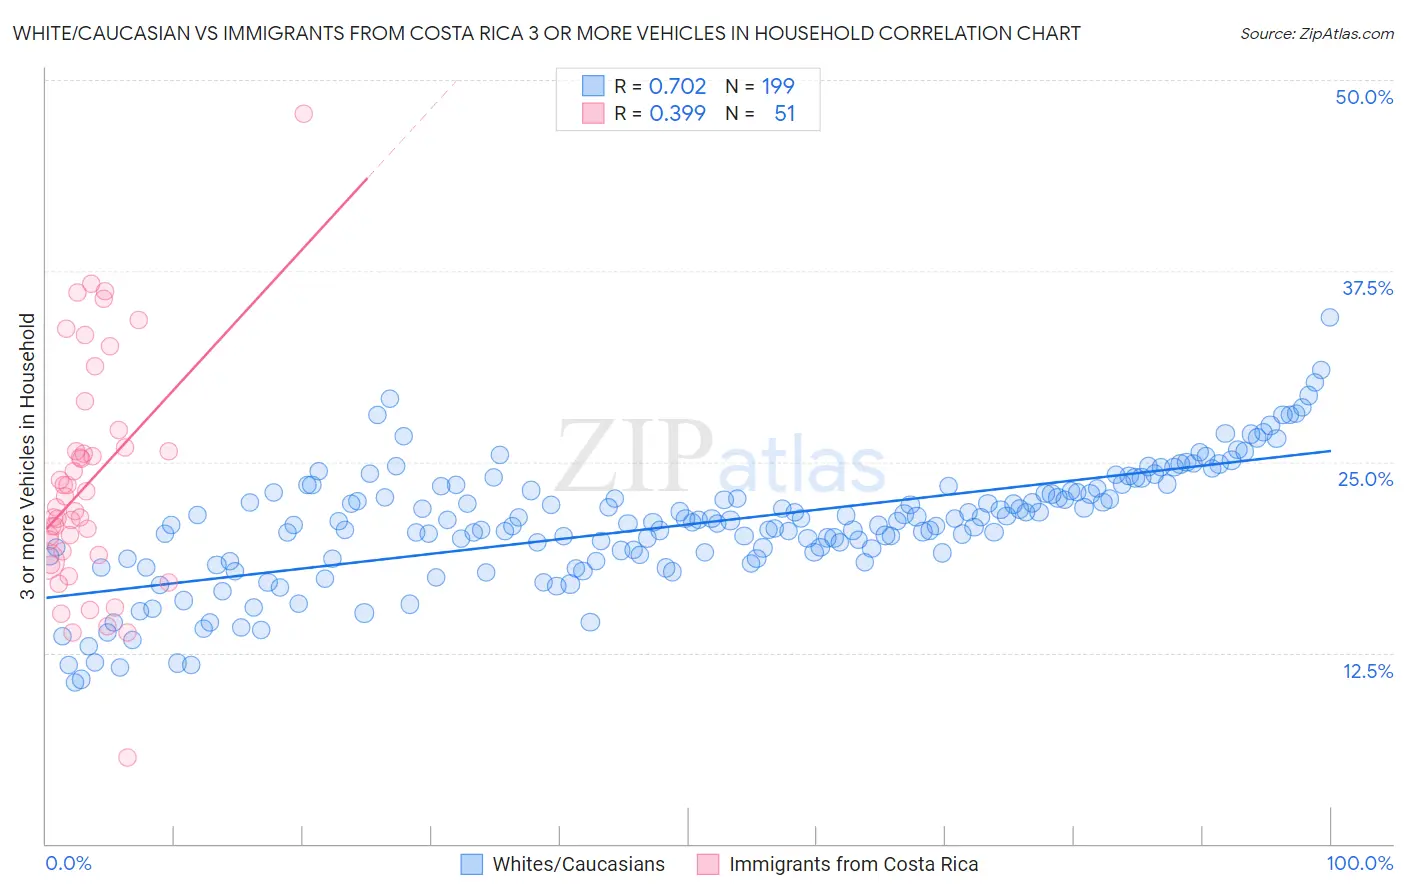
White/Caucasian vs Immigrants from Costa Rica 3 or more Vehicles in Household Correlation Chart
The statistical analysis conducted on geographies consisting of 571,274,380 people shows a strong positive correlation between the proportion of Whites/Caucasians and percentage of households with 3 or more vehicles available in the United States with a correlation coefficient (R) of 0.702 and weighted average of 22.6%. Similarly, the statistical analysis conducted on geographies consisting of 204,232,387 people shows a mild positive correlation between the proportion of Immigrants from Costa Rica and percentage of households with 3 or more vehicles available in the United States with a correlation coefficient (R) of 0.399 and weighted average of 19.7%, a difference of 14.7%.
3 or more Vehicles in Household Correlation Summary
| Measurement | White/Caucasian | Immigrants from Costa Rica |
| Minimum | 10.6% | 5.6% |
| Maximum | 34.4% | 47.8% |
| Range | 23.8% | 42.2% |
| Mean | 20.9% | 23.6% |
| Median | 21.1% | 22.0% |
| Interquartile 25% (IQ1) | 18.8% | 18.9% |
| Interquartile 75% (IQ3) | 23.1% | 26.0% |
| Interquartile Range (IQR) | 4.3% | 7.0% |
| Standard Deviation (Sample) | 4.0% | 7.6% |
| Standard Deviation (Population) | 4.0% | 7.5% |
Similar Demographics by 3 or more Vehicles in Household
Demographics Similar to Whites/Caucasians by 3 or more Vehicles in Household
In terms of 3 or more vehicles in household, the demographic groups most similar to Whites/Caucasians are Sioux (22.6%, a difference of 0.010%), Welsh (22.6%, a difference of 0.040%), Scotch-Irish (22.6%, a difference of 0.060%), Scottish (22.6%, a difference of 0.17%), and Malaysian (22.6%, a difference of 0.18%).
| Demographics | Rating | Rank | 3 or more Vehicles in Household |
| Cheyenne | 100.0 /100 | #44 | Exceptional 22.7% |
| Ute | 100.0 /100 | #45 | Exceptional 22.7% |
| Americans | 100.0 /100 | #46 | Exceptional 22.6% |
| Malaysians | 100.0 /100 | #47 | Exceptional 22.6% |
| Scottish | 100.0 /100 | #48 | Exceptional 22.6% |
| Scotch-Irish | 100.0 /100 | #49 | Exceptional 22.6% |
| Sioux | 100.0 /100 | #50 | Exceptional 22.6% |
| Whites/Caucasians | 100.0 /100 | #51 | Exceptional 22.6% |
| Welsh | 100.0 /100 | #52 | Exceptional 22.6% |
| Czechs | 100.0 /100 | #53 | Exceptional 22.5% |
| Crow | 100.0 /100 | #54 | Exceptional 22.5% |
| Immigrants | Laos | 100.0 /100 | #55 | Exceptional 22.4% |
| Hispanics or Latinos | 100.0 /100 | #56 | Exceptional 22.4% |
| Pennsylvania Germans | 100.0 /100 | #57 | Exceptional 22.3% |
| Spaniards | 100.0 /100 | #58 | Exceptional 22.3% |
Demographics Similar to Immigrants from Costa Rica by 3 or more Vehicles in Household
In terms of 3 or more vehicles in household, the demographic groups most similar to Immigrants from Costa Rica are Yugoslavian (19.7%, a difference of 0.080%), Immigrants from Cameroon (19.7%, a difference of 0.080%), Chilean (19.7%, a difference of 0.090%), Estonian (19.7%, a difference of 0.11%), and Ukrainian (19.6%, a difference of 0.24%).
| Demographics | Rating | Rank | 3 or more Vehicles in Household |
| Armenians | 68.8 /100 | #158 | Good 19.8% |
| Immigrants | Pakistan | 68.2 /100 | #159 | Good 19.8% |
| Immigrants | Lebanon | 67.6 /100 | #160 | Good 19.8% |
| Immigrants | Guatemala | 65.6 /100 | #161 | Good 19.7% |
| Estonians | 63.2 /100 | #162 | Good 19.7% |
| Chileans | 63.0 /100 | #163 | Good 19.7% |
| Yugoslavians | 62.9 /100 | #164 | Good 19.7% |
| Immigrants | Costa Rica | 61.9 /100 | #165 | Good 19.7% |
| Immigrants | Cameroon | 60.9 /100 | #166 | Good 19.7% |
| Ukrainians | 58.9 /100 | #167 | Average 19.6% |
| Peruvians | 58.8 /100 | #168 | Average 19.6% |
| Immigrants | Denmark | 57.6 /100 | #169 | Average 19.6% |
| Iraqis | 56.0 /100 | #170 | Average 19.6% |
| Immigrants | Western Europe | 53.2 /100 | #171 | Average 19.5% |
| Kiowa | 50.9 /100 | #172 | Average 19.5% |