Cherokee vs Immigrants from Costa Rica 3 or more Vehicles in Household
COMPARE
Cherokee
Immigrants from Costa Rica
3 or more Vehicles in Household
3 or more Vehicles in Household Comparison
Cherokee
Immigrants from Costa Rica
23.0%
3 OR MORE VEHICLES IN HOUSEHOLD
100.0/ 100
METRIC RATING
36th/ 347
METRIC RANK
19.7%
3 OR MORE VEHICLES IN HOUSEHOLD
61.9/ 100
METRIC RATING
165th/ 347
METRIC RANK
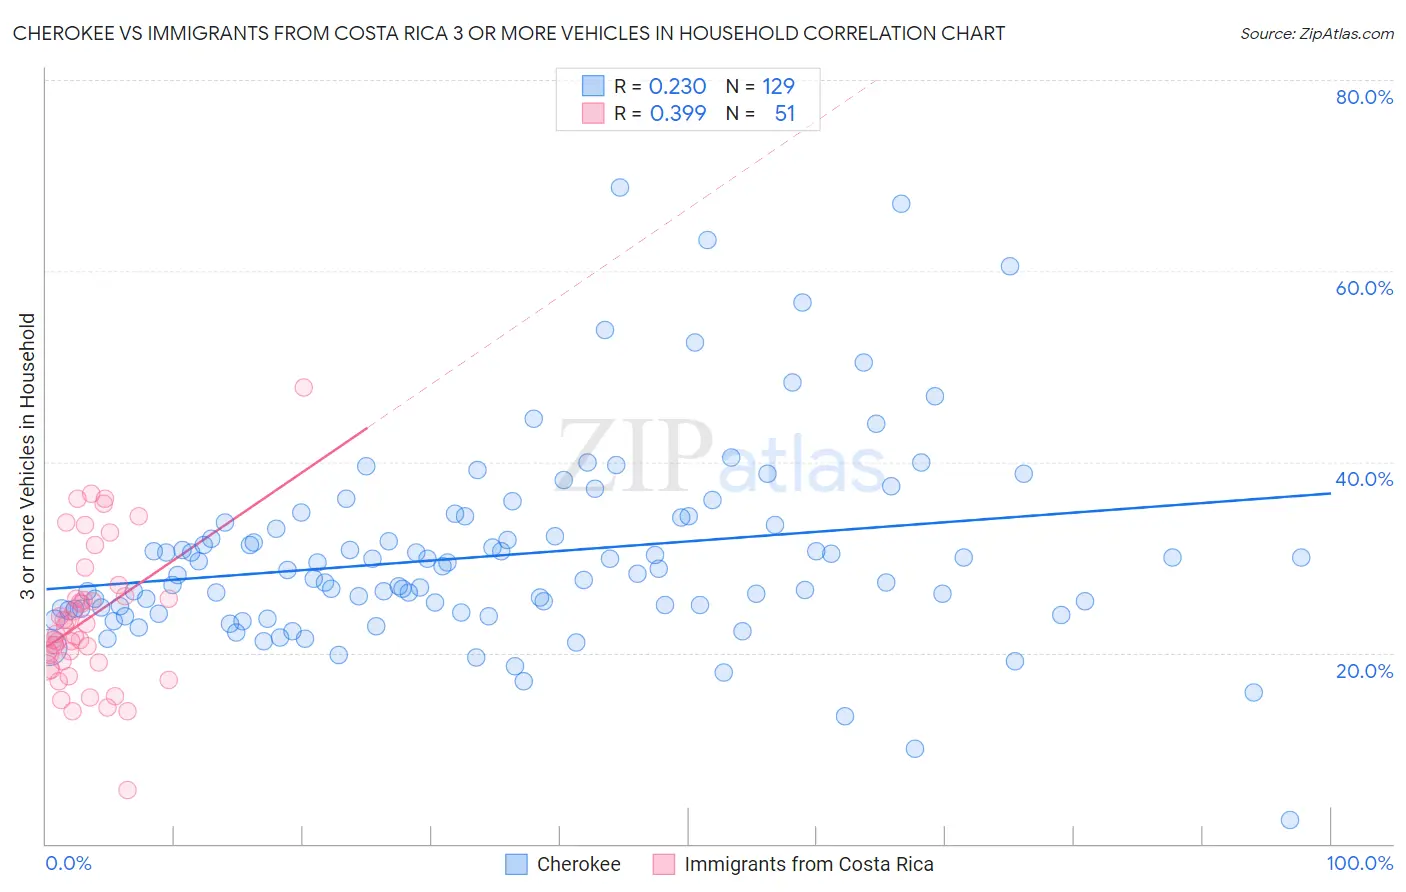
Cherokee vs Immigrants from Costa Rica 3 or more Vehicles in Household Correlation Chart
The statistical analysis conducted on geographies consisting of 493,301,702 people shows a weak positive correlation between the proportion of Cherokee and percentage of households with 3 or more vehicles available in the United States with a correlation coefficient (R) of 0.230 and weighted average of 23.0%. Similarly, the statistical analysis conducted on geographies consisting of 204,232,387 people shows a mild positive correlation between the proportion of Immigrants from Costa Rica and percentage of households with 3 or more vehicles available in the United States with a correlation coefficient (R) of 0.399 and weighted average of 19.7%, a difference of 16.8%.
3 or more Vehicles in Household Correlation Summary
| Measurement | Cherokee | Immigrants from Costa Rica |
| Minimum | 2.4% | 5.6% |
| Maximum | 68.8% | 47.8% |
| Range | 66.3% | 42.2% |
| Mean | 30.2% | 23.6% |
| Median | 28.3% | 22.0% |
| Interquartile 25% (IQ1) | 24.5% | 18.9% |
| Interquartile 75% (IQ3) | 33.5% | 26.0% |
| Interquartile Range (IQR) | 9.0% | 7.0% |
| Standard Deviation (Sample) | 10.2% | 7.6% |
| Standard Deviation (Population) | 10.2% | 7.5% |
Similar Demographics by 3 or more Vehicles in Household
Demographics Similar to Cherokee by 3 or more Vehicles in Household
In terms of 3 or more vehicles in household, the demographic groups most similar to Cherokee are Swedish (23.0%, a difference of 0.030%), Choctaw (23.0%, a difference of 0.040%), Swiss (23.0%, a difference of 0.060%), Spanish American (23.0%, a difference of 0.11%), and Pueblo (23.0%, a difference of 0.17%).
| Demographics | Rating | Rank | 3 or more Vehicles in Household |
| Spanish | 100.0 /100 | #29 | Exceptional 23.1% |
| Immigrants | South Eastern Asia | 100.0 /100 | #30 | Exceptional 23.1% |
| English | 100.0 /100 | #31 | Exceptional 23.1% |
| Pueblo | 100.0 /100 | #32 | Exceptional 23.0% |
| Spanish Americans | 100.0 /100 | #33 | Exceptional 23.0% |
| Swiss | 100.0 /100 | #34 | Exceptional 23.0% |
| Choctaw | 100.0 /100 | #35 | Exceptional 23.0% |
| Cherokee | 100.0 /100 | #36 | Exceptional 23.0% |
| Swedes | 100.0 /100 | #37 | Exceptional 23.0% |
| Dutch | 100.0 /100 | #38 | Exceptional 22.9% |
| Yaqui | 100.0 /100 | #39 | Exceptional 22.9% |
| Europeans | 100.0 /100 | #40 | Exceptional 22.9% |
| Germans | 100.0 /100 | #41 | Exceptional 22.7% |
| Natives/Alaskans | 100.0 /100 | #42 | Exceptional 22.7% |
| Osage | 100.0 /100 | #43 | Exceptional 22.7% |
Demographics Similar to Immigrants from Costa Rica by 3 or more Vehicles in Household
In terms of 3 or more vehicles in household, the demographic groups most similar to Immigrants from Costa Rica are Yugoslavian (19.7%, a difference of 0.080%), Immigrants from Cameroon (19.7%, a difference of 0.080%), Chilean (19.7%, a difference of 0.090%), Estonian (19.7%, a difference of 0.11%), and Ukrainian (19.6%, a difference of 0.24%).
| Demographics | Rating | Rank | 3 or more Vehicles in Household |
| Armenians | 68.8 /100 | #158 | Good 19.8% |
| Immigrants | Pakistan | 68.2 /100 | #159 | Good 19.8% |
| Immigrants | Lebanon | 67.6 /100 | #160 | Good 19.8% |
| Immigrants | Guatemala | 65.6 /100 | #161 | Good 19.7% |
| Estonians | 63.2 /100 | #162 | Good 19.7% |
| Chileans | 63.0 /100 | #163 | Good 19.7% |
| Yugoslavians | 62.9 /100 | #164 | Good 19.7% |
| Immigrants | Costa Rica | 61.9 /100 | #165 | Good 19.7% |
| Immigrants | Cameroon | 60.9 /100 | #166 | Good 19.7% |
| Ukrainians | 58.9 /100 | #167 | Average 19.6% |
| Peruvians | 58.8 /100 | #168 | Average 19.6% |
| Immigrants | Denmark | 57.6 /100 | #169 | Average 19.6% |
| Iraqis | 56.0 /100 | #170 | Average 19.6% |
| Immigrants | Western Europe | 53.2 /100 | #171 | Average 19.5% |
| Kiowa | 50.9 /100 | #172 | Average 19.5% |