Immigrants from Zaire vs Albanian 3 or more Vehicles in Household
COMPARE
Immigrants from Zaire
Albanian
3 or more Vehicles in Household
3 or more Vehicles in Household Comparison
Immigrants from Zaire
Albanians
16.7%
3 OR MORE VEHICLES IN HOUSEHOLD
0.1/ 100
METRIC RATING
298th/ 347
METRIC RANK
15.8%
3 OR MORE VEHICLES IN HOUSEHOLD
0.0/ 100
METRIC RATING
311th/ 347
METRIC RANK
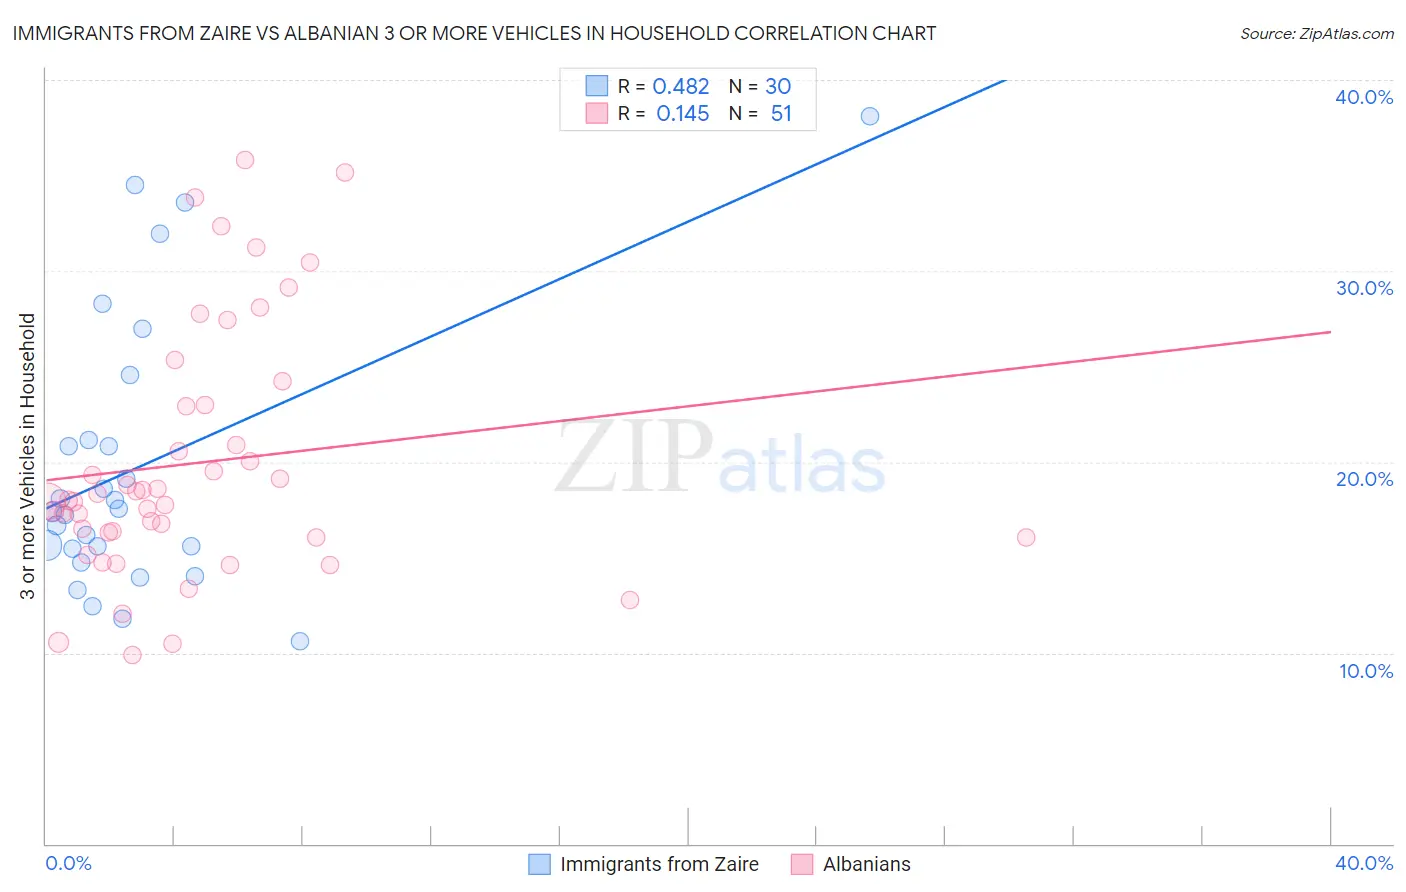
Immigrants from Zaire vs Albanian 3 or more Vehicles in Household Correlation Chart
The statistical analysis conducted on geographies consisting of 107,239,583 people shows a moderate positive correlation between the proportion of Immigrants from Zaire and percentage of households with 3 or more vehicles available in the United States with a correlation coefficient (R) of 0.482 and weighted average of 16.7%. Similarly, the statistical analysis conducted on geographies consisting of 193,117,321 people shows a poor positive correlation between the proportion of Albanians and percentage of households with 3 or more vehicles available in the United States with a correlation coefficient (R) of 0.145 and weighted average of 15.8%, a difference of 5.8%.
3 or more Vehicles in Household Correlation Summary
| Measurement | Immigrants from Zaire | Albanian |
| Minimum | 10.6% | 9.9% |
| Maximum | 38.1% | 35.8% |
| Range | 27.5% | 25.9% |
| Mean | 19.8% | 20.0% |
| Median | 17.5% | 18.0% |
| Interquartile 25% (IQ1) | 15.4% | 16.1% |
| Interquartile 75% (IQ3) | 21.1% | 23.0% |
| Interquartile Range (IQR) | 5.7% | 6.9% |
| Standard Deviation (Sample) | 7.2% | 6.5% |
| Standard Deviation (Population) | 7.1% | 6.4% |
Demographics Similar to Immigrants from Zaire and Albanians by 3 or more Vehicles in Household
In terms of 3 or more vehicles in household, the demographic groups most similar to Immigrants from Zaire are Immigrants from South America (16.7%, a difference of 0.060%), Israeli (16.8%, a difference of 0.37%), Cypriot (16.6%, a difference of 0.54%), Inupiat (16.9%, a difference of 0.84%), and Paraguayan (16.6%, a difference of 0.95%). Similarly, the demographic groups most similar to Albanians are Moroccan (15.9%, a difference of 0.50%), Immigrants from Somalia (15.9%, a difference of 0.74%), Puerto Rican (15.6%, a difference of 1.1%), Immigrants from Israel (15.6%, a difference of 1.2%), and Houma (16.1%, a difference of 1.7%).
| Demographics | Rating | Rank | 3 or more Vehicles in Household |
| Immigrants | Western Africa | 0.1 /100 | #294 | Tragic 16.9% |
| Immigrants | Russia | 0.1 /100 | #295 | Tragic 16.9% |
| Inupiat | 0.1 /100 | #296 | Tragic 16.9% |
| Israelis | 0.1 /100 | #297 | Tragic 16.8% |
| Immigrants | Zaire | 0.1 /100 | #298 | Tragic 16.7% |
| Immigrants | South America | 0.1 /100 | #299 | Tragic 16.7% |
| Cypriots | 0.0 /100 | #300 | Tragic 16.6% |
| Paraguayans | 0.0 /100 | #301 | Tragic 16.6% |
| Immigrants | Greece | 0.0 /100 | #302 | Tragic 16.5% |
| Immigrants | Serbia | 0.0 /100 | #303 | Tragic 16.4% |
| Ghanaians | 0.0 /100 | #304 | Tragic 16.4% |
| Immigrants | Morocco | 0.0 /100 | #305 | Tragic 16.3% |
| Somalis | 0.0 /100 | #306 | Tragic 16.2% |
| Immigrants | Ghana | 0.0 /100 | #307 | Tragic 16.2% |
| Houma | 0.0 /100 | #308 | Tragic 16.1% |
| Immigrants | Somalia | 0.0 /100 | #309 | Tragic 15.9% |
| Moroccans | 0.0 /100 | #310 | Tragic 15.9% |
| Albanians | 0.0 /100 | #311 | Tragic 15.8% |
| Puerto Ricans | 0.0 /100 | #312 | Tragic 15.6% |
| Immigrants | Israel | 0.0 /100 | #313 | Tragic 15.6% |
| Immigrants | Belarus | 0.0 /100 | #314 | Tragic 15.5% |