Immigrants from Zaire vs Assyrian/Chaldean/Syriac 3 or more Vehicles in Household
COMPARE
Immigrants from Zaire
Assyrian/Chaldean/Syriac
3 or more Vehicles in Household
3 or more Vehicles in Household Comparison
Immigrants from Zaire
Assyrians/Chaldeans/Syriacs
16.7%
3 OR MORE VEHICLES IN HOUSEHOLD
0.1/ 100
METRIC RATING
298th/ 347
METRIC RANK
21.7%
3 OR MORE VEHICLES IN HOUSEHOLD
99.8/ 100
METRIC RATING
79th/ 347
METRIC RANK
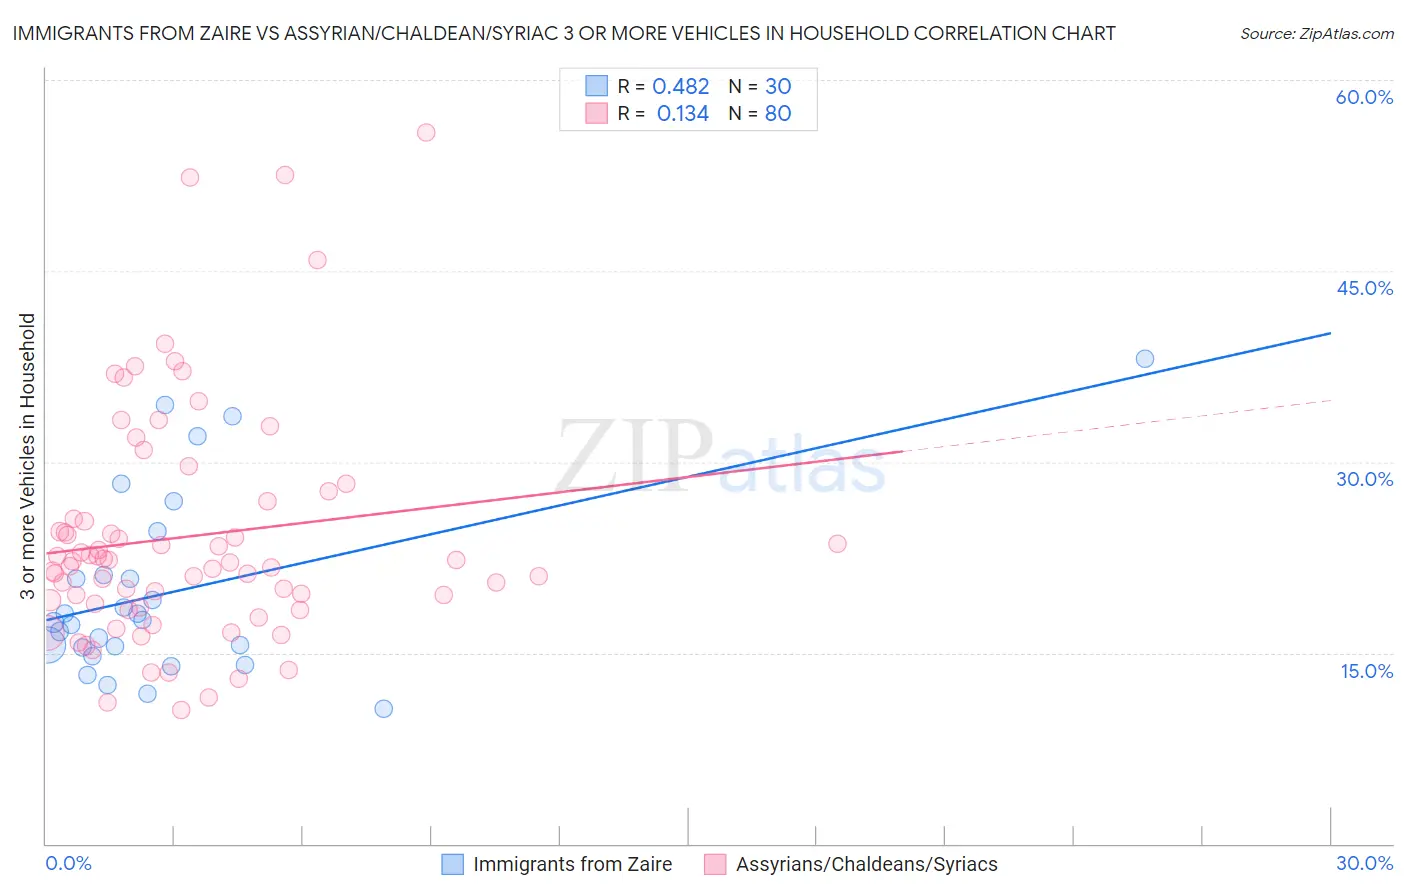
Immigrants from Zaire vs Assyrian/Chaldean/Syriac 3 or more Vehicles in Household Correlation Chart
The statistical analysis conducted on geographies consisting of 107,239,583 people shows a moderate positive correlation between the proportion of Immigrants from Zaire and percentage of households with 3 or more vehicles available in the United States with a correlation coefficient (R) of 0.482 and weighted average of 16.7%. Similarly, the statistical analysis conducted on geographies consisting of 110,285,741 people shows a poor positive correlation between the proportion of Assyrians/Chaldeans/Syriacs and percentage of households with 3 or more vehicles available in the United States with a correlation coefficient (R) of 0.134 and weighted average of 21.7%, a difference of 30.0%.
3 or more Vehicles in Household Correlation Summary
| Measurement | Immigrants from Zaire | Assyrian/Chaldean/Syriac |
| Minimum | 10.6% | 10.5% |
| Maximum | 38.1% | 55.9% |
| Range | 27.5% | 45.4% |
| Mean | 19.8% | 24.1% |
| Median | 17.5% | 22.1% |
| Interquartile 25% (IQ1) | 15.4% | 18.7% |
| Interquartile 75% (IQ3) | 21.1% | 26.2% |
| Interquartile Range (IQR) | 5.7% | 7.4% |
| Standard Deviation (Sample) | 7.2% | 9.2% |
| Standard Deviation (Population) | 7.1% | 9.1% |
Similar Demographics by 3 or more Vehicles in Household
Demographics Similar to Immigrants from Zaire by 3 or more Vehicles in Household
In terms of 3 or more vehicles in household, the demographic groups most similar to Immigrants from Zaire are Immigrants from South America (16.7%, a difference of 0.060%), Israeli (16.8%, a difference of 0.37%), Cypriot (16.6%, a difference of 0.54%), Inupiat (16.9%, a difference of 0.84%), and Paraguayan (16.6%, a difference of 0.95%).
| Demographics | Rating | Rank | 3 or more Vehicles in Household |
| Immigrants | Congo | 0.1 /100 | #291 | Tragic 17.0% |
| Immigrants | Spain | 0.1 /100 | #292 | Tragic 17.0% |
| Bahamians | 0.1 /100 | #293 | Tragic 16.9% |
| Immigrants | Western Africa | 0.1 /100 | #294 | Tragic 16.9% |
| Immigrants | Russia | 0.1 /100 | #295 | Tragic 16.9% |
| Inupiat | 0.1 /100 | #296 | Tragic 16.9% |
| Israelis | 0.1 /100 | #297 | Tragic 16.8% |
| Immigrants | Zaire | 0.1 /100 | #298 | Tragic 16.7% |
| Immigrants | South America | 0.1 /100 | #299 | Tragic 16.7% |
| Cypriots | 0.0 /100 | #300 | Tragic 16.6% |
| Paraguayans | 0.0 /100 | #301 | Tragic 16.6% |
| Immigrants | Greece | 0.0 /100 | #302 | Tragic 16.5% |
| Immigrants | Serbia | 0.0 /100 | #303 | Tragic 16.4% |
| Ghanaians | 0.0 /100 | #304 | Tragic 16.4% |
| Immigrants | Morocco | 0.0 /100 | #305 | Tragic 16.3% |
Demographics Similar to Assyrians/Chaldeans/Syriacs by 3 or more Vehicles in Household
In terms of 3 or more vehicles in household, the demographic groups most similar to Assyrians/Chaldeans/Syriacs are Czechoslovakian (21.7%, a difference of 0.0%), Irish (21.8%, a difference of 0.13%), Nonimmigrants (21.8%, a difference of 0.20%), Afghan (21.7%, a difference of 0.20%), and Japanese (21.8%, a difference of 0.25%).
| Demographics | Rating | Rank | 3 or more Vehicles in Household |
| Portuguese | 99.8 /100 | #72 | Exceptional 21.8% |
| Salvadorans | 99.8 /100 | #73 | Exceptional 21.8% |
| Immigrants | Oceania | 99.8 /100 | #74 | Exceptional 21.8% |
| Japanese | 99.8 /100 | #75 | Exceptional 21.8% |
| Immigrants | Nonimmigrants | 99.8 /100 | #76 | Exceptional 21.8% |
| Irish | 99.8 /100 | #77 | Exceptional 21.8% |
| Czechoslovakians | 99.8 /100 | #78 | Exceptional 21.7% |
| Assyrians/Chaldeans/Syriacs | 99.8 /100 | #79 | Exceptional 21.7% |
| Afghans | 99.7 /100 | #80 | Exceptional 21.7% |
| Celtics | 99.7 /100 | #81 | Exceptional 21.7% |
| Immigrants | El Salvador | 99.6 /100 | #82 | Exceptional 21.5% |
| Chippewa | 99.6 /100 | #83 | Exceptional 21.5% |
| Icelanders | 99.6 /100 | #84 | Exceptional 21.5% |
| Laotians | 99.6 /100 | #85 | Exceptional 21.5% |
| Delaware | 99.6 /100 | #86 | Exceptional 21.5% |