Immigrants from Zaire vs Marshallese 3 or more Vehicles in Household
COMPARE
Immigrants from Zaire
Marshallese
3 or more Vehicles in Household
3 or more Vehicles in Household Comparison
Immigrants from Zaire
Marshallese
16.7%
3 OR MORE VEHICLES IN HOUSEHOLD
0.1/ 100
METRIC RATING
298th/ 347
METRIC RANK
21.3%
3 OR MORE VEHICLES IN HOUSEHOLD
99.2/ 100
METRIC RATING
89th/ 347
METRIC RANK
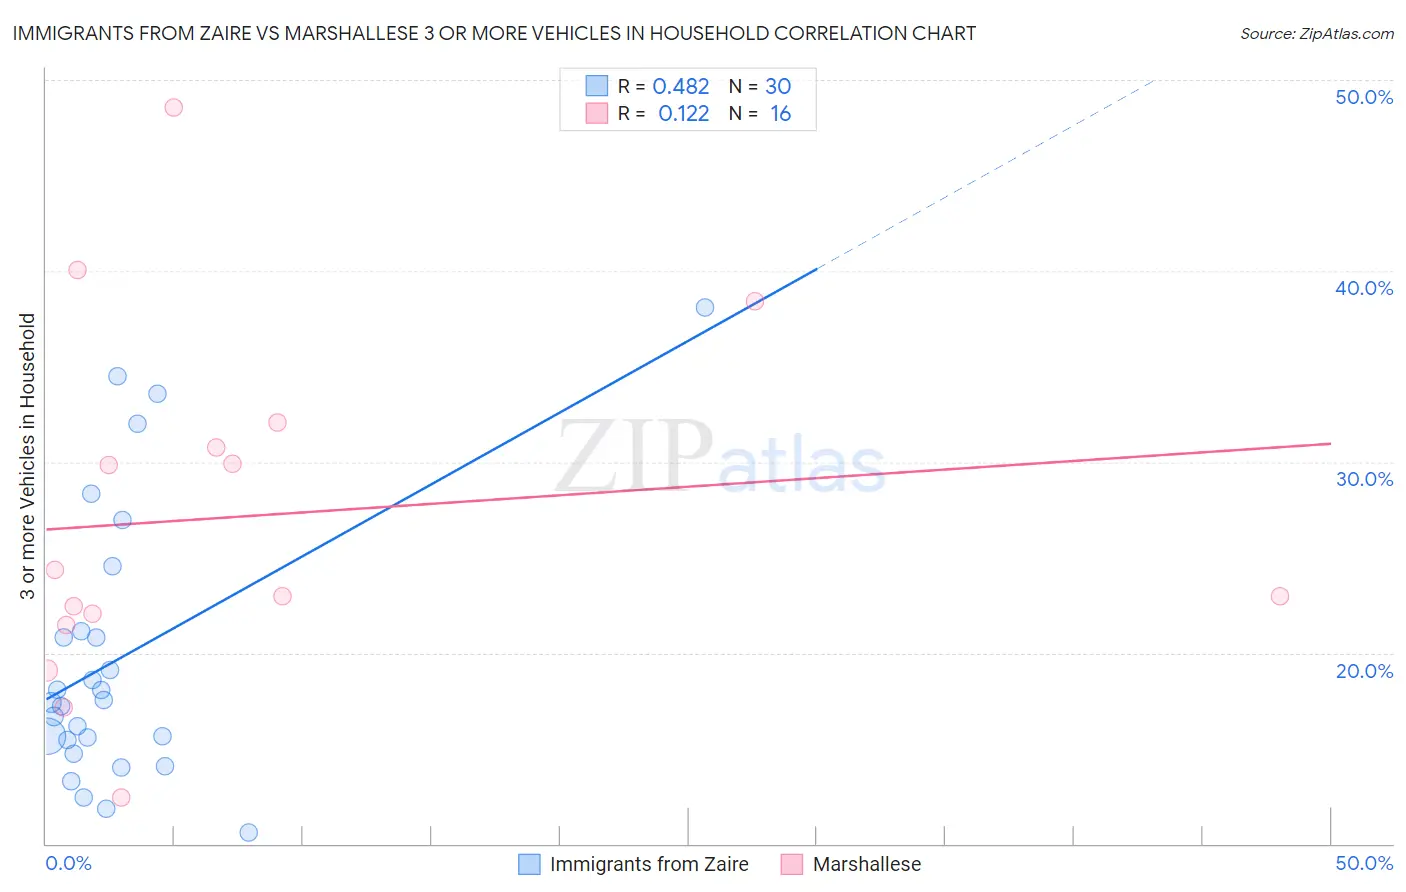
Immigrants from Zaire vs Marshallese 3 or more Vehicles in Household Correlation Chart
The statistical analysis conducted on geographies consisting of 107,239,583 people shows a moderate positive correlation between the proportion of Immigrants from Zaire and percentage of households with 3 or more vehicles available in the United States with a correlation coefficient (R) of 0.482 and weighted average of 16.7%. Similarly, the statistical analysis conducted on geographies consisting of 14,761,315 people shows a poor positive correlation between the proportion of Marshallese and percentage of households with 3 or more vehicles available in the United States with a correlation coefficient (R) of 0.122 and weighted average of 21.3%, a difference of 27.4%.
3 or more Vehicles in Household Correlation Summary
| Measurement | Immigrants from Zaire | Marshallese |
| Minimum | 10.6% | 12.4% |
| Maximum | 38.1% | 48.6% |
| Range | 27.5% | 36.2% |
| Mean | 19.8% | 27.2% |
| Median | 17.5% | 23.7% |
| Interquartile 25% (IQ1) | 15.4% | 21.8% |
| Interquartile 75% (IQ3) | 21.1% | 31.4% |
| Interquartile Range (IQR) | 5.7% | 9.6% |
| Standard Deviation (Sample) | 7.2% | 9.3% |
| Standard Deviation (Population) | 7.1% | 9.0% |
Similar Demographics by 3 or more Vehicles in Household
Demographics Similar to Immigrants from Zaire by 3 or more Vehicles in Household
In terms of 3 or more vehicles in household, the demographic groups most similar to Immigrants from Zaire are Immigrants from South America (16.7%, a difference of 0.060%), Israeli (16.8%, a difference of 0.37%), Cypriot (16.6%, a difference of 0.54%), Inupiat (16.9%, a difference of 0.84%), and Paraguayan (16.6%, a difference of 0.95%).
| Demographics | Rating | Rank | 3 or more Vehicles in Household |
| Immigrants | Congo | 0.1 /100 | #291 | Tragic 17.0% |
| Immigrants | Spain | 0.1 /100 | #292 | Tragic 17.0% |
| Bahamians | 0.1 /100 | #293 | Tragic 16.9% |
| Immigrants | Western Africa | 0.1 /100 | #294 | Tragic 16.9% |
| Immigrants | Russia | 0.1 /100 | #295 | Tragic 16.9% |
| Inupiat | 0.1 /100 | #296 | Tragic 16.9% |
| Israelis | 0.1 /100 | #297 | Tragic 16.8% |
| Immigrants | Zaire | 0.1 /100 | #298 | Tragic 16.7% |
| Immigrants | South America | 0.1 /100 | #299 | Tragic 16.7% |
| Cypriots | 0.0 /100 | #300 | Tragic 16.6% |
| Paraguayans | 0.0 /100 | #301 | Tragic 16.6% |
| Immigrants | Greece | 0.0 /100 | #302 | Tragic 16.5% |
| Immigrants | Serbia | 0.0 /100 | #303 | Tragic 16.4% |
| Ghanaians | 0.0 /100 | #304 | Tragic 16.4% |
| Immigrants | Morocco | 0.0 /100 | #305 | Tragic 16.3% |
Demographics Similar to Marshallese by 3 or more Vehicles in Household
In terms of 3 or more vehicles in household, the demographic groups most similar to Marshallese are Immigrants from Afghanistan (21.2%, a difference of 0.22%), Belgian (21.2%, a difference of 0.55%), French (21.4%, a difference of 0.56%), Apache (21.2%, a difference of 0.63%), and Immigrants from the Azores (21.5%, a difference of 0.82%).
| Demographics | Rating | Rank | 3 or more Vehicles in Household |
| Immigrants | El Salvador | 99.6 /100 | #82 | Exceptional 21.5% |
| Chippewa | 99.6 /100 | #83 | Exceptional 21.5% |
| Icelanders | 99.6 /100 | #84 | Exceptional 21.5% |
| Laotians | 99.6 /100 | #85 | Exceptional 21.5% |
| Delaware | 99.6 /100 | #86 | Exceptional 21.5% |
| Immigrants | Azores | 99.5 /100 | #87 | Exceptional 21.5% |
| French | 99.4 /100 | #88 | Exceptional 21.4% |
| Marshallese | 99.2 /100 | #89 | Exceptional 21.3% |
| Immigrants | Afghanistan | 99.1 /100 | #90 | Exceptional 21.2% |
| Belgians | 98.9 /100 | #91 | Exceptional 21.2% |
| Apache | 98.9 /100 | #92 | Exceptional 21.2% |
| Immigrants | Indonesia | 98.8 /100 | #93 | Exceptional 21.1% |
| Immigrants | Cambodia | 98.6 /100 | #94 | Exceptional 21.1% |
| Pakistanis | 98.5 /100 | #95 | Exceptional 21.0% |
| Cree | 98.4 /100 | #96 | Exceptional 21.0% |