Immigrants from Zaire vs Russian Associate's Degree
COMPARE
Immigrants from Zaire
Russian
Associate's Degree
Associate's Degree Comparison
Immigrants from Zaire
Russians
45.0%
ASSOCIATE'S DEGREE
16.6/ 100
METRIC RATING
211th/ 347
METRIC RANK
53.2%
ASSOCIATE'S DEGREE
100.0/ 100
METRIC RATING
35th/ 347
METRIC RANK
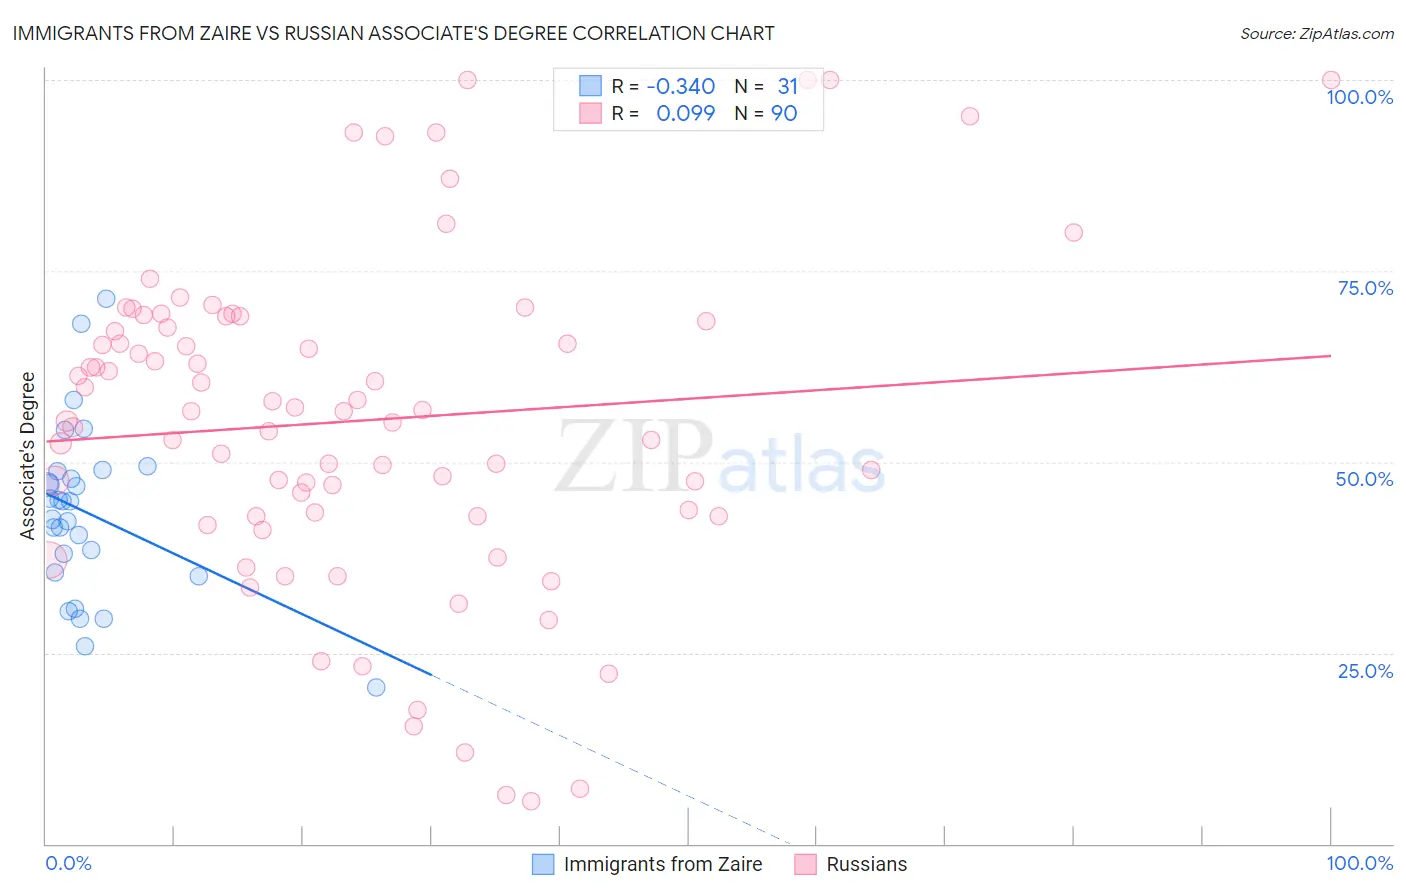
Immigrants from Zaire vs Russian Associate's Degree Correlation Chart
The statistical analysis conducted on geographies consisting of 107,255,700 people shows a mild negative correlation between the proportion of Immigrants from Zaire and percentage of population with at least associate's degree education in the United States with a correlation coefficient (R) of -0.340 and weighted average of 45.0%. Similarly, the statistical analysis conducted on geographies consisting of 512,209,602 people shows a slight positive correlation between the proportion of Russians and percentage of population with at least associate's degree education in the United States with a correlation coefficient (R) of 0.099 and weighted average of 53.2%, a difference of 18.4%.
Associate's Degree Correlation Summary
| Measurement | Immigrants from Zaire | Russian |
| Minimum | 20.5% | 5.6% |
| Maximum | 71.3% | 100.0% |
| Range | 50.8% | 94.4% |
| Mean | 43.3% | 55.4% |
| Median | 44.8% | 56.6% |
| Interquartile 25% (IQ1) | 35.5% | 42.9% |
| Interquartile 75% (IQ3) | 48.8% | 68.4% |
| Interquartile Range (IQR) | 13.3% | 25.5% |
| Standard Deviation (Sample) | 11.2% | 21.5% |
| Standard Deviation (Population) | 11.0% | 21.3% |
Similar Demographics by Associate's Degree
Demographics Similar to Immigrants from Zaire by Associate's Degree
In terms of associate's degree, the demographic groups most similar to Immigrants from Zaire are Immigrants from Costa Rica (45.0%, a difference of 0.010%), Immigrants from Philippines (45.0%, a difference of 0.010%), Dutch (45.0%, a difference of 0.13%), Panamanian (45.1%, a difference of 0.23%), and French Canadian (44.9%, a difference of 0.23%).
| Demographics | Rating | Rank | Associate's Degree |
| Nigerians | 19.1 /100 | #204 | Poor 45.1% |
| Immigrants | Thailand | 18.9 /100 | #205 | Poor 45.1% |
| German Russians | 18.9 /100 | #206 | Poor 45.1% |
| Panamanians | 18.4 /100 | #207 | Poor 45.1% |
| Dutch | 17.6 /100 | #208 | Poor 45.0% |
| Immigrants | Costa Rica | 16.7 /100 | #209 | Poor 45.0% |
| Immigrants | Philippines | 16.7 /100 | #210 | Poor 45.0% |
| Immigrants | Zaire | 16.6 /100 | #211 | Poor 45.0% |
| French Canadians | 15.0 /100 | #212 | Poor 44.9% |
| Immigrants | Ghana | 14.2 /100 | #213 | Poor 44.8% |
| Immigrants | Middle Africa | 12.7 /100 | #214 | Poor 44.7% |
| Immigrants | Panama | 12.4 /100 | #215 | Poor 44.7% |
| Immigrants | Nigeria | 11.4 /100 | #216 | Poor 44.6% |
| Immigrants | Immigrants | 10.5 /100 | #217 | Poor 44.5% |
| Spanish | 9.4 /100 | #218 | Tragic 44.4% |
Demographics Similar to Russians by Associate's Degree
In terms of associate's degree, the demographic groups most similar to Russians are Bulgarian (53.3%, a difference of 0.060%), Israeli (53.4%, a difference of 0.26%), Immigrants from Russia (53.1%, a difference of 0.28%), Immigrants from Denmark (53.1%, a difference of 0.36%), and Immigrants from Turkey (53.4%, a difference of 0.38%).
| Demographics | Rating | Rank | Associate's Degree |
| Turks | 100.0 /100 | #28 | Exceptional 53.9% |
| Immigrants | France | 100.0 /100 | #29 | Exceptional 53.9% |
| Immigrants | Sri Lanka | 100.0 /100 | #30 | Exceptional 53.7% |
| Immigrants | Northern Europe | 100.0 /100 | #31 | Exceptional 53.5% |
| Immigrants | Turkey | 100.0 /100 | #32 | Exceptional 53.4% |
| Israelis | 100.0 /100 | #33 | Exceptional 53.4% |
| Bulgarians | 100.0 /100 | #34 | Exceptional 53.3% |
| Russians | 100.0 /100 | #35 | Exceptional 53.2% |
| Immigrants | Russia | 100.0 /100 | #36 | Exceptional 53.1% |
| Immigrants | Denmark | 100.0 /100 | #37 | Exceptional 53.1% |
| Mongolians | 100.0 /100 | #38 | Exceptional 53.0% |
| Immigrants | Belarus | 99.9 /100 | #39 | Exceptional 52.8% |
| Immigrants | Latvia | 99.9 /100 | #40 | Exceptional 52.8% |
| Immigrants | Saudi Arabia | 99.9 /100 | #41 | Exceptional 52.6% |
| Immigrants | Malaysia | 99.9 /100 | #42 | Exceptional 52.5% |