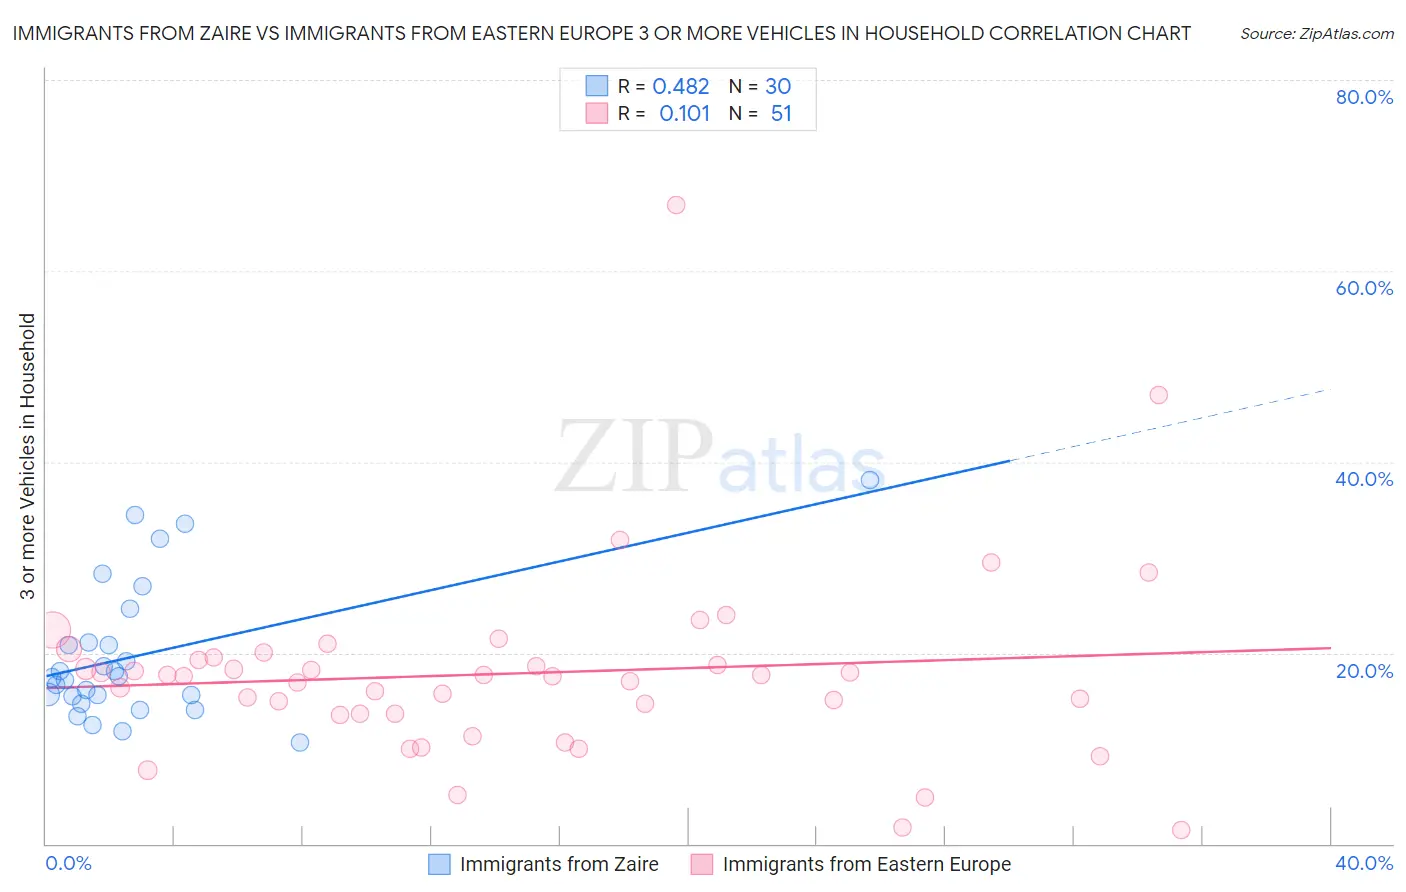
Immigrants from Zaire vs Immigrants from Eastern Europe 3 or more Vehicles in Household
COMPARE
Immigrants from Zaire
Immigrants from Eastern Europe
3 or more Vehicles in Household
3 or more Vehicles in Household Comparison
Immigrants from Zaire
Immigrants from Eastern Europe
16.7%
3 OR MORE VEHICLES IN HOUSEHOLD
0.1/ 100
METRIC RATING
298th/ 347
METRIC RANK
17.4%
3 OR MORE VEHICLES IN HOUSEHOLD
0.3/ 100
METRIC RATING
280th/ 347
METRIC RANK
Immigrants from Zaire vs Immigrants from Eastern Europe 3 or more Vehicles in Household Correlation Chart
The statistical analysis conducted on geographies consisting of 107,239,583 people shows a moderate positive correlation between the proportion of Immigrants from Zaire and percentage of households with 3 or more vehicles available in the United States with a correlation coefficient (R) of 0.482 and weighted average of 16.7%. Similarly, the statistical analysis conducted on geographies consisting of 475,306,541 people shows a poor positive correlation between the proportion of Immigrants from Eastern Europe and percentage of households with 3 or more vehicles available in the United States with a correlation coefficient (R) of 0.101 and weighted average of 17.4%, a difference of 4.1%.
3 or more Vehicles in Household Correlation Summary
| Measurement | Immigrants from Zaire | Immigrants from Eastern Europe |
| Minimum | 10.6% | 1.4% |
| Maximum | 38.1% | 66.9% |
| Range | 27.5% | 65.5% |
| Mean | 19.8% | 17.8% |
| Median | 17.5% | 17.6% |
| Interquartile 25% (IQ1) | 15.4% | 13.6% |
| Interquartile 75% (IQ3) | 21.1% | 19.5% |
| Interquartile Range (IQR) | 5.7% | 5.9% |
| Standard Deviation (Sample) | 7.2% | 10.3% |
| Standard Deviation (Population) | 7.1% | 10.2% |
Demographics Similar to Immigrants from Zaire and Immigrants from Eastern Europe by 3 or more Vehicles in Household
In terms of 3 or more vehicles in household, the demographic groups most similar to Immigrants from Zaire are Immigrants from South America (16.7%, a difference of 0.060%), Israeli (16.8%, a difference of 0.37%), Inupiat (16.9%, a difference of 0.84%), Immigrants from Russia (16.9%, a difference of 1.2%), and Immigrants from Western Africa (16.9%, a difference of 1.3%). Similarly, the demographic groups most similar to Immigrants from Eastern Europe are Immigrants from Kazakhstan (17.4%, a difference of 0.040%), Immigrants from Latvia (17.4%, a difference of 0.040%), Immigrants from Ireland (17.3%, a difference of 0.33%), Black/African American (17.3%, a difference of 0.38%), and Immigrants from Colombia (17.3%, a difference of 0.50%).
| Demographics | Rating | Rank | 3 or more Vehicles in Household |
| Immigrants | Kazakhstan | 0.3 /100 | #279 | Tragic 17.4% |
| Immigrants | Eastern Europe | 0.3 /100 | #280 | Tragic 17.4% |
| Immigrants | Latvia | 0.3 /100 | #281 | Tragic 17.4% |
| Immigrants | Ireland | 0.3 /100 | #282 | Tragic 17.3% |
| Blacks/African Americans | 0.3 /100 | #283 | Tragic 17.3% |
| Immigrants | Colombia | 0.3 /100 | #284 | Tragic 17.3% |
| Immigrants | Croatia | 0.2 /100 | #285 | Tragic 17.2% |
| Menominee | 0.2 /100 | #286 | Tragic 17.2% |
| Immigrants | Brazil | 0.2 /100 | #287 | Tragic 17.1% |
| Immigrants | Uruguay | 0.2 /100 | #288 | Tragic 17.1% |
| Immigrants | Liberia | 0.1 /100 | #289 | Tragic 17.1% |
| Liberians | 0.1 /100 | #290 | Tragic 17.0% |
| Immigrants | Congo | 0.1 /100 | #291 | Tragic 17.0% |
| Immigrants | Spain | 0.1 /100 | #292 | Tragic 17.0% |
| Bahamians | 0.1 /100 | #293 | Tragic 16.9% |
| Immigrants | Western Africa | 0.1 /100 | #294 | Tragic 16.9% |
| Immigrants | Russia | 0.1 /100 | #295 | Tragic 16.9% |
| Inupiat | 0.1 /100 | #296 | Tragic 16.9% |
| Israelis | 0.1 /100 | #297 | Tragic 16.8% |
| Immigrants | Zaire | 0.1 /100 | #298 | Tragic 16.7% |
| Immigrants | South America | 0.1 /100 | #299 | Tragic 16.7% |